Published

August 31, 2026

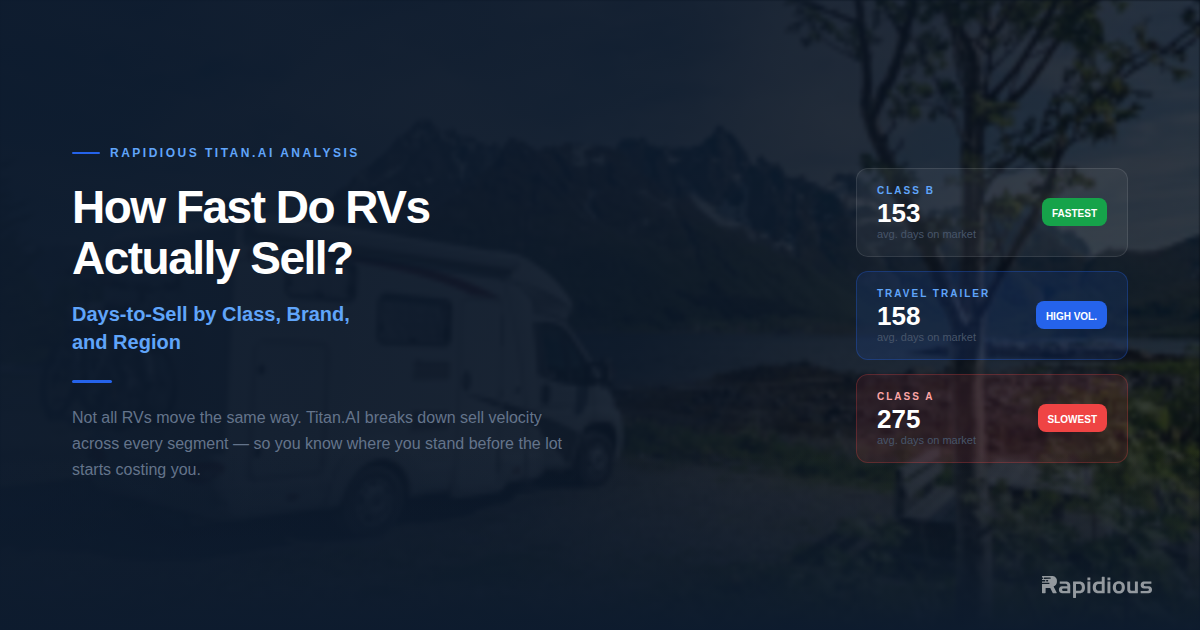
How Fast Do RVs Actually Sell? Days-to-Sell by Class, Brand, and Region — A Rapidious Titan.AI Analysis

Stop managing inventory by instinct; Rapidious Titan.AI provides real-time velocity data across classes, regions, and brands to turn guesswork into strategy. Use these benchmarks to identify stale stock, optimize trade-in appraisals, and prevent costly "dead capital."

Deeksha Makhija

Brand Storyteller & Marketing Lead

Summarize with AI

Table of Contents

Where Does Your Lot Actually Stand?

Listed value and real selling price aren't the same. See if your lot is overpriced, underpriced or sitting for longer than it should be.

Book a demo
See your inventory vs. market in 30 minutes.

"How long should this RV take to sell?" is one of the most common questions in the RV industry. However, because dealers often work off instinct or quarterly lot results, it is rarely answered with precision. Rapidious Titan.AI changes that by tracking actual sold-unit velocity and inventory age across every major class, region, and brand.

By leveraging Rapidious Titan.AI market data, we can move past guesswork to answer the inventory turn question properly, providing dealers with the market intelligence needed to protect gross margin and optimize capital allocation.

A methodology note: the Class and Region figures below are derived from analysis of confirmed sales data—measuring the exact days between listing and sale for units that have cleared the market. The Brand figures utilize Rapidious Titan.AI market data on the current on-lot age of unsold inventory. This serves as a meaningful proxy for brand-level movement and helps dealers identify potential floor-plan interest risks before they compound.

Days-to-sell by class

According to our market data, sold-unit velocity varies more within a single class—between new and used—than it does between most classes. This distinction is critical for dealers managing trade-in appraisals and inventory turnover.

Class Days to sell (new) Days to sell (used) Days to sell (all)
Class B 161.9 109.7 141.8
Pop-up Camper 176.3 100.3 145.5
Class A 204.3 137.3 156.0
Truck Camper 179.1 120.5 157.1
Travel Trailer 184.8 113.7 158.1
Class C 201.1 118.8 159.6
Fifth Wheel 197.8 111.9 162.0
Toy Hauler (Travel Trailer) 200.6 130.1 164.4
Teardrop Trailer 209.2 107.9 171.0
Toy Hauler (Fifth Wheel) 224.8 113.8 173.5
Destination Trailer 202.7 108.6 177.7

Rapidious Titan.AI's analysis identifies Class B as the fastest-moving class overall. However, the consistent pattern across all classes is that used units sell in roughly half the time of new units, representing a significant opportunity for pre-owned departments to increase turn speed.

A used Fifth Wheel sells in about 112 days; a new one takes almost 200 days. That gap is the single most useful number on this table — it's larger than the difference between the fastest class and the slowest one.

Actionable Intelligence FAQs

Q: How can dealers use this class-velocity data to optimize inventory?

A: Prioritize high-velocity units like Class B RVs to increase floor-plan turnover. Use these benchmarks to identify "stale" units early—if a unit exceeds its class average, it likely requires immediate aggressive marketing or price adjustments.

Q: How should the new-vs-used sales gap influence my trade-in offers?

A: Leverage the fact that used units sell in roughly half the time of new ones. You can afford to be more competitive on used trade-in offers for high-demand classes, knowing the capital will likely be tied up for significantly less time than a new unit purchase.

Days-to-sell by region

By weighting inventory volume across every state, Rapidious Titan.AI analysis provides a clear regional read on market velocity:

Region Days to sell (weighted average)
West 148.0
South 149.0
Northeast 160.5
Midwest 173.9
National average ~155

West and South are effectively tied for fastest, the Northeast sits in the middle, and the Midwest is the clear laggard — roughly 26 days slower than the West on average. 

Individual states surface even sharper insights within the Rapidious Titan.AI market data: Texas (128.3 days) and Idaho (132.5 days) are the fastest-turning markets, while Midwest states like Ohio (226.9 days) anchor the slow end. This regional variance directly impacts the carrying cost of inventory.

Actionable Intelligence FAQs

Q: Why are Midwest states like Ohio and Kansas showing slower turn times?

A: These states often experience higher inventory saturation relative to localized demand or seasonal buying fluctuations. Recognizing these "anchor" states allows dealers to differentiate between a general market slowdown and a specific regional inefficiency.

Q: Should I adjust my stocking strategy if I am based in a slower region like the Midwest?

A: Yes. In slower regions, inventory-holding costs are higher. Dealers should focus on "sure-thing" brands and used units that beat regional averages rather than speculative new inventory that may sit for 200+ days.

Brand-level inventory age 

This section applies Rapidious Titan.AI analysis to the median age of unsold inventory, weighted by volume. This "stale inventory" metric is a vital diagnostic for lot health and margin protection across top manufacturers.

Brand Avg. age, new inventory (days) Avg. age, used inventory (days) Gap (new minus used)
Palomino 144.6 134.6 10
Winnebago 163.6 152.0 12
Jayco 174.2 111.1 63
Forest River 171.0 124.6 46
Heartland 180.2 162.3 18
Keystone 194.0 122.2 72
Coachmen 198.8 146.7 52
Grand Design 188.1 81.1 107
Airstream 208.0 146.0 62
Alliance 198.3 89.0 109
Thor 212.9 151.8 61
Dutchmen 265.6 166.9 99

Rapidious Titan.AI market data shows that Palomino maintains the most aligned new- and used-inventory ages. Meanwhile, Grand Design and Alliance show strong used-market momentum with the youngest median inventory ages in the group.

As with any inventory-age measure, these figures reflect the current mix of units on the lot and should be viewed as a directional indicator of market movement—not a direct measure of how long a specific RV will take to sell.

Actionable Intelligence FAQs

Q: Why should I look at inventory age differently than confirmed sales speed?

A: Inventory age is a "right now" diagnostic of your current lot health. While sales speed tells you what happened, age tells you what is currently costing you money and which brands are struggling to attract buyers in the current climate.

Q: How can I identify a brand with high used-market demand using this data?

A: Look for brands with the lowest used-inventory age, such as Grand Design or Alliance. A young used-inventory age indicates that even as units are traded in, they are "turning" quickly, representing a safer acquisition for your pre-owned department.

Why this matters for appraisals and buying

A data point only has value when measured against the right baseline. Rapidious Titan.AI analysis demonstrates that 150 days for a new Fifth Wheel in the Midwest is performing near expectations, while the same duration for a used Class B in the West indicates a significant appraisal or pricing error.

Rapidious Titan.AI closes the gap between instinct and evidence, providing a real-time market intelligence baseline for every major class, region, and brand combination.

Book a demo to see these baselines applied to your own inventory, unit by unit, in real time.

Actionable Intelligence FAQs

Q: How can I implement these benchmarks in my dealership today?

A: Start by benchmarking your "slowest" 10% of units against these class and regional averages. If your specific inventory is lagging significantly behind, prioritize those units for immediate price correction or re-marketing to stop the bleed on holding costs.

Q: How should RV dealers reduce aging inventory?

A: The primary risk is "dead capital." When you don't know the expected turn-time for a specific class or region, you may overpay for trade-ins or stock units that have a high probability of sitting for 200+ days, effectively reducing your overall dealership profitability.

Q: Why is relying on industry "instinct" a financial risk in the current market?

A: Inventory management based on guesswork ignores critical class-specific and regional demand shifts. Without real-time velocity data, dealers risk holding stale units that tie up capital, while missing opportunities to move high-demand inventory faster.

Q: How does Titan.AI velocity data differ from typical industry surveys?

A: Unlike static, lagging surveys, Titan.AI tracks actual, day-to-day sales velocity. This provides a dynamic baseline that updates as market conditions change, allowing for immediate, evidence-based adjustments to your buying and pricing strategy.

About Rapidious Titan.AI

Rapidious Titan.AI is the market intelligence platform built for U.S. RV dealerships. It gives dealers a live view of RV transaction prices, inventory velocity, regional supply, and carrying cost risk—across local, regional, and national markets—so that every pricing and appraisal decision is grounded in what the market is actually clearing at today. By converting raw market data into actionable intelligence, it helps dealers reduce margin leakage and improve overall dealership profitability.

Your post has been created! We are redirecting you to your live post. This might take a few seconds.
Thank you! Your post has been received. Once approved, you will receive an email with a link to your live post.
Oops! Something went wrong while submitting the form.
Responses
--
First
Last
Author
2 days ago
Custom Field
0

-

ReplyDelete
First
Last
Author
2 days ago
Custom Field
0
0

Heading 2

Heading 3

Heading 4

Lorem ipsum dolor sit amet, consectetur adipiscing elit, sed do

Ordered list

  1. Item 1

Unordered list

  • Item A

Text link

Bold text

Emphasis

-

ReplyDelete

RV Market Intelligence, Delivered Weekly.

Actionable insights on pricing shifts, inventory velocity, competitive positioning built from market derived intelligence.

Thank you! Your submission has been received!
Oops! Something went wrong while submitting the form.

Link successfully copied

Have a question?

Ask about pricing, appraisals, or how Rapidious Titan.AI works for your rooftops. We'll get back to you within 24 hours.

Pricing questions specific to your lot

Help reading your inventory benchmarks

Getting up Rapidious Titan.AI for your rooftops

Anything else you're not sure who to ask

2,600
+

dealer rooftops monitored

$
14.4
B+

in live retail inventory

$
47.9
B+

in RV sales tracked

Takes 30 seconds
Thank you! Your submission has been received!
Oops! Something went wrong while submitting the form.
See what your inventory is actually worth
Bring a few units from your lot and we'll show you what the real market data says.
Thank you! Your submission has been received!
Oops! Something went wrong while submitting the form.

In 30 minutes, we'll pull your real stock numbers and match them

Book a Call

```html