
.png)
Analysis by Rapidious Titan.AI - the market intelligence platform built for U.S. RV dealerships
TL;DR: When used RV averages sit above new, it’s usually a product‑mix problem that raises floor‑plan costs and crushes margins. The fix: price used Class As to recent transaction reality, tighten trade‑in appraisals, reset aged inventory at 90 days, and list a price for every unit.
How Should RV Dealers Price Used RV Inventory When Averages Invert?
Across U.S. RV dealerships, one of the most misread pricing signals is when used inventory averages sit above new: a pattern that looks like a data error but is actually a product mix problem with real cost implications. If you're running a dealership in Arizona, California, or Tennessee and your used average is sitting above your new average, you're not looking at a data error. You're looking at a product mix situation - one that's worth understanding clearly before drawing conclusions or making moves.

What does data reveal about this situation?
It's a product mix scenario. Based on Rapidious Titan.AI market data, in these three states, used inventory is heavily weighted toward premium Class A motorhomes - originally purchased by retirement-stage buyers, now returning as trade-ins. New inventory, meanwhile, is dominated by affordable towables: travel trailers and entry-level fifth wheels priced between $35,000 and $65,000.
The used average gets pulled up by expensive Class A units. The new average gets pulled down by lower-priced towables. The result looks like an inversion, but what it's really showing you is that the two pools contain very different products.
Understanding that distinction is the first step to getting ahead of it.

What This Mix May Be Costing Dealers?
Cost 1 - A gap between listed price and what buyers will pay
The gap between current listed prices and actual sale prices on used units ranges from around 19% in California to nearly 33% in Tennessee (Rapidious Titan.AI transaction data, 7 months of closed transactions).
These are not negotiation outcomes. They are the prices the market is settling at. The question worth asking is how much carrying cost accumulates between the listing price and the exit price.

Cost 2 - Floor plan interest on units that will sell for less
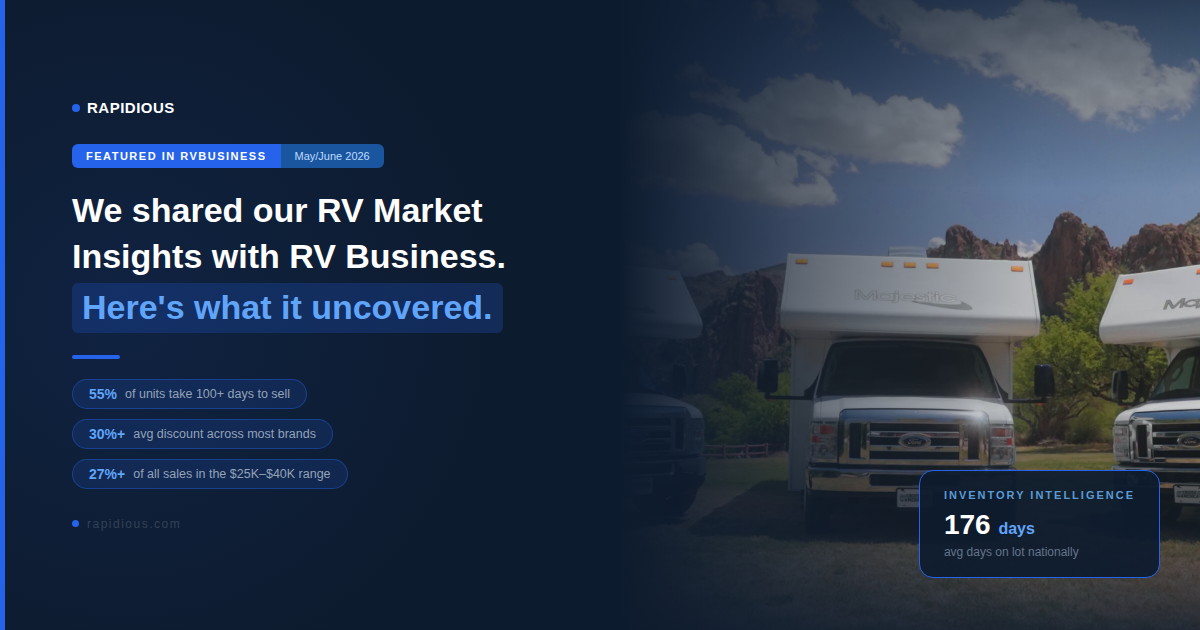
Based on Rapidious Titan.AI market data, used units in Arizona are averaging 225 days on lot versus 168 for new - a 57-day gap. California sits at 209 vs 150 days. Tennessee at 193 vs 151 (Rapidious Titan.AI inventory data, April 2026). A Class A motorhome financed at 7% with a $100,000 cost generates roughly $7,000 in annual floor plan interest. When the eventual sale price is closer to $64,000, that carrying cost becomes a real drag on gross.
The longer a unit sits at a price the market isn't accepting, the more that gap compounds.
Cost 3 - Unpriced listings that make inventory invisible
In Arizona, 43.8% of used inventory carries no listed price online. California sits at 34.5% (Rapidious Titan.AI inventory data, April 2026). The intent is often to preserve negotiating room. The effect is that value-oriented buyers - the ones most actively searching for used RVs - filter by price range and never see those units at all. An unpriced listing doesn't create leverage. It creates invisibility.
The Rapidious Dealer Inversion Playbook
At Rapidious, we call this approach the Rapidious Dealer Inversion Playbook - four decisions that convert a pricing misalignment into a margin recovery.
Decision 1 - Align used Class A listing prices with transaction reality
If used Class A units in your state have been closing 19-33% below current listings for seven months, that closing price is the market price. Listing at it from day one shortens time on lot, reduces floor plan cost, and doesn't change where you end up - only how long it takes to get there.
A useful starting point: pull your last 90 days of used Class A transaction prices and use those as your listing baseline. Reprice any aged unit against the same data.
Decision 2 - Revisit how you're appraising Class A trade-ins
The inversion often begins at trade-in acceptance. When a Class A is accepted at a value that requires listing it above new to stay whole, the carrying cost problem is already built in. Appraising against realistic exit prices - recent transaction data rather than book value or original purchase price - gives you a listing price that the market will actually meet.
A lower trade-in offer that produces a sellable unit is worth more than a generous one that produces 200 days on lot.
Decision 3 - Treat aged inventory as a capital priority
Tennessee dealers are repricing 31% of used inventory every two weeks - but in increments too small to close the gap quickly. One meaningful reset at 90 days outperforms five partial cuts over six months. Once a unit passes 200 days, the carrying cost has already moved against you.
A 90-day trigger for a reset of 10% or more - not a cosmetic trim - tends to produce better outcomes than gradual adjustments.
One meaningful reset at 90 days outperforms five partial cuts over six months. Once a unit passes 200 days, carrying cost has already moved against you." - Rapidious Titan.AI, the market intelligence platform built for U.S. RV dealerships
Decision 4 - Put a price on every unit
Buyers searching for used RVs search by price. If a unit isn't priced, it isn't in their results. Visible, realistically priced inventory clears faster and at better gross than inventory waiting for an inbound call that may not come.
Price every unit in your used inventory. Base it on transaction data, not on what it cost you at trade-in.

The Bottom Line
The inversion in your averages isn't a permanent feature of these markets, and it isn't something that requires a complete overhaul to address. It's a pricing alignment problem, which means it's also a pricing alignment opportunity.
- Realistic used pricing shortens time on lot. Shorter time on lot cuts floor plan cost. Less floor plan cost means more of the gross you make stays with you. Tighter trade-in discipline means the next Class A that rolls in doesn't restart the cycle.
- The market has already indicated what it will pay. Arizona: $64,411. California: $53,617. Tennessee: $41,225. Getting your listings to those numbers sooner rather than later is the most direct path to better outcomes on your used inventory.
Rapidious Titan.AI is the market intelligence platform built for U.S. RV dealerships. It gives dealers a live view of transaction prices, inventory velocity, and days-on-lot benchmarks across local, regional, and national markets - so decisions on pricing, trade-in appraisals, and aged inventory are grounded in what the market is actually clearing at, not gut feel or lagging book values. The four decisions in the Rapidious Dealer Inversion Playbook are built around exactly this data.
See how it works - rapidious.com
.svg)


-
Heading 2
Heading 3
Heading 4
Lorem ipsum dolor sit amet, consectetur adipiscing elit, sed do
Ordered list
Unordered list
Text link
Bold text
Emphasis
-