


Where Does Your Lot Actually Stand?
Listed value and real selling price aren't the same. See if your lot is overpriced, underpriced or sitting for longer than it should be.
In September 2026, the roughly 195,000 RVs in U.S. dealer inventory tracked by Rapidious Titan had been on the lot for about 170 days on average. Region by region, that average barely moved: from about 160 days in the Northeast to about 177 days in the West, a spread of 17 days.
Look inside a single segment and the picture changes. Class A motorhomes had been sitting about 134 days in the Midwest and about 223 days in the South: a gap of 89 days, more than five times the regional spread.
That is the most useful finding in this data. A broad average can hide large differences within a category, so a unit sitting below its regional average isn't necessarily well positioned to sell.
This guide covers four U.S. regions, with a closer look at Class A motorhomes. It explains what the figures can and can't tell you, and how to judge your own units against comparable competing inventory.
What "days on lot" means here
Days on lot is the number of calendar days a unit has been publicly listed for sale. It counts from the day the listing first appears online until the day it stops appearing. For units still for sale, as in this analysis, it counts up to the latest data date. Figures cover new and used units combined. Because the count starts when the listing goes online, a unit's physical time on the lot may be somewhat longer.
This measures how long unsold units have been sitting, not how long units took to sell, so it isn't a measure of selling speed. A region's average can run higher because units are moving slowly, but also because of its model-year mix, its share of used units, or how much it stocked ahead of demand.
All figures come from a single September 2026 snapshot. They show where inventory age stood that month, not a trend.
The big finding: averages hide an 89-day gap
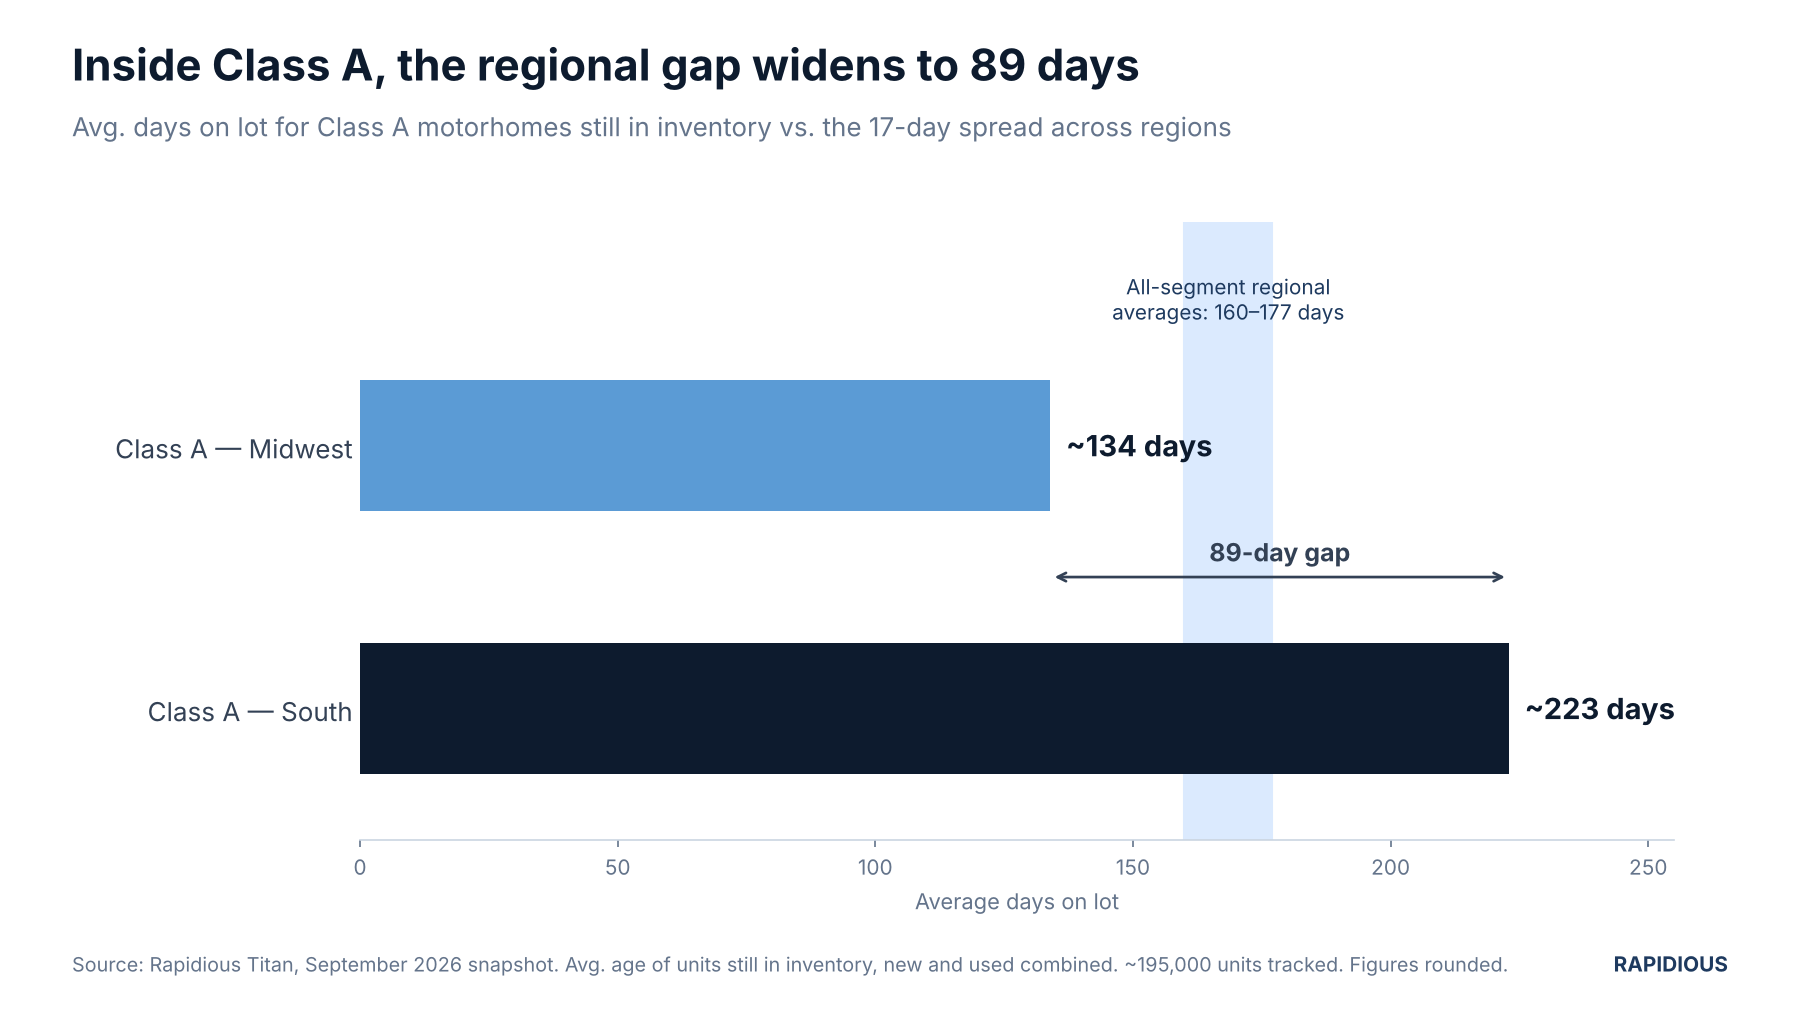
In this snapshot, Class A motorhomes in Southern inventory had been sitting about 223 days on average, compared with about 134 days in the Midwest.
That 89-day gap is more than five times the 17-day spread between the all-segment regional averages. The data alone doesn't explain why. Model-year mix, new versus used share, stocking levels and local demand could each play a part.
What it does show is why averages are a weak test for an individual unit. Take a hypothetical Class A that has been on your lot for 170 days. It sits right at the four-region average, well below the South's Class A average, and well above the Midwest's. None of those comparisons tells you whether the unit is positioned to sell. Only comparable competing units can.
How long RVs were sitting, by region
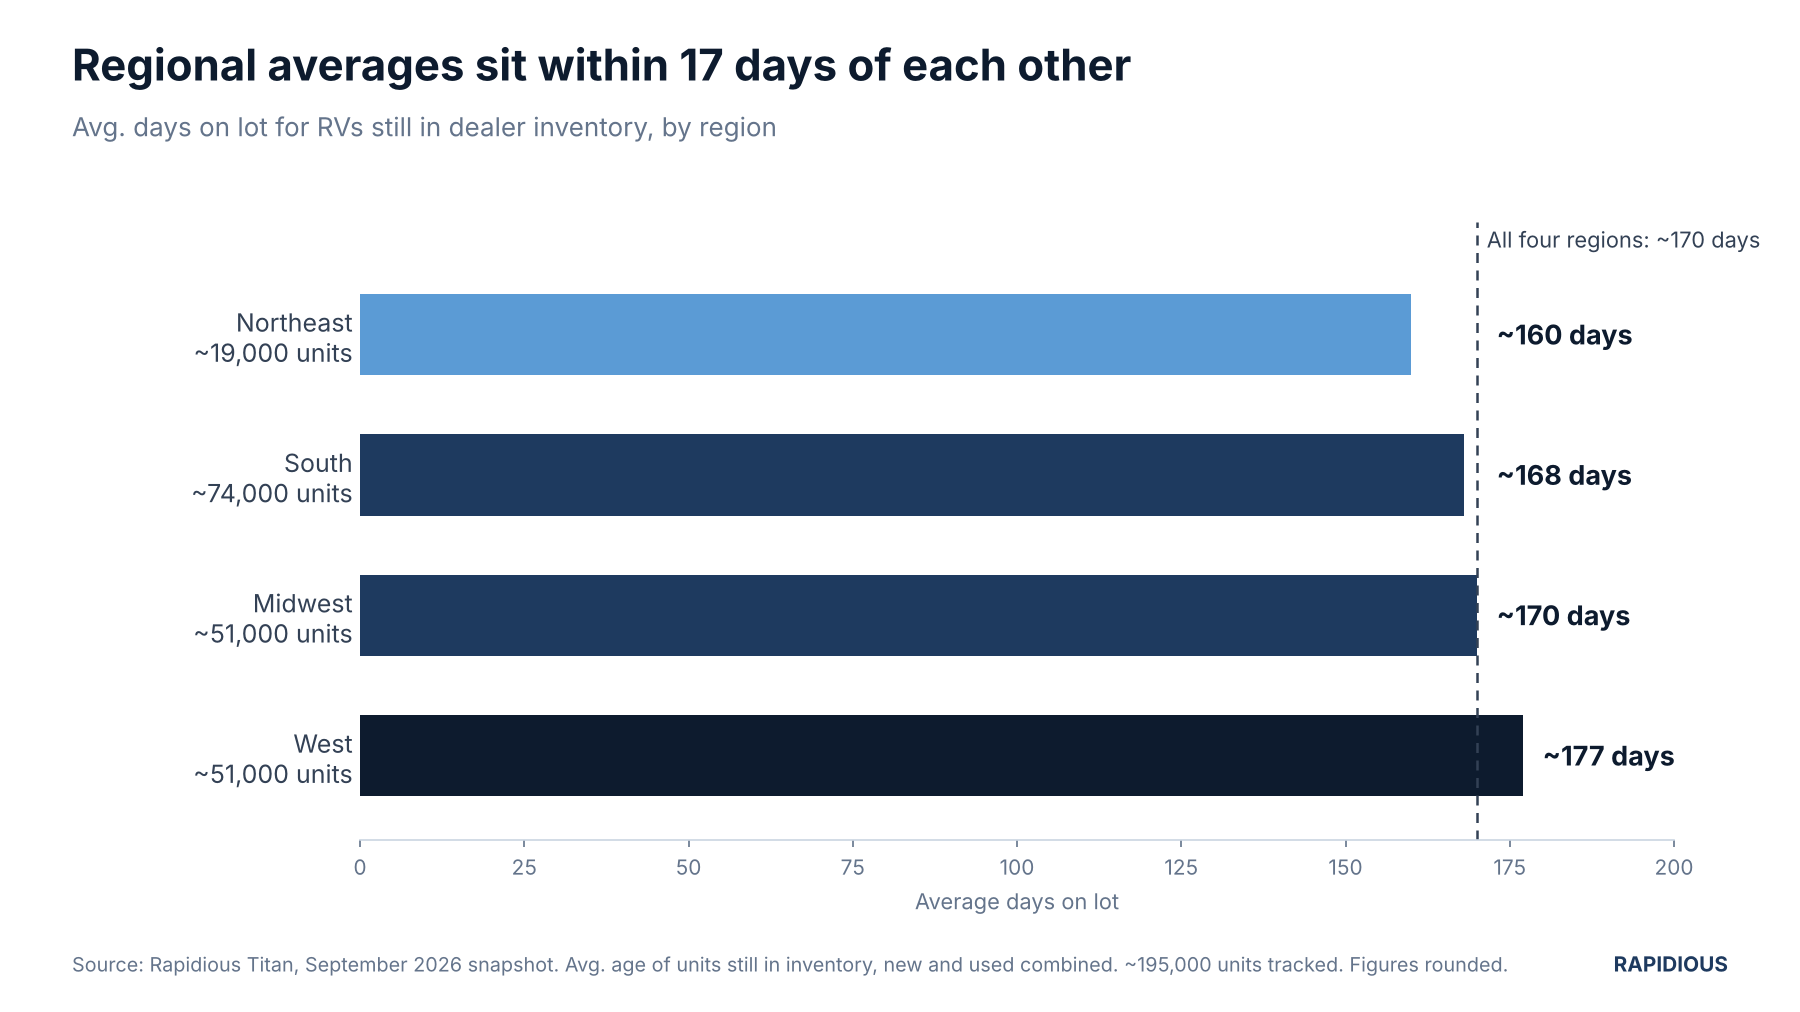
Units in Northeast inventory had been sitting about 10 days less than the four-region average, and units in the West about 7 days more.
The South held the most inventory by a wide margin, about 74,000 units, nearly four times the Northeast's 19,000. Yet its average age, about 168 days, was close to the overall figure. How much inventory a region holds and how long that inventory has been sitting are separate questions.
National, regional, local: what each level answers
- Four-region (national) average: where inventory age stood overall in September 2026. One snapshot shows a level, not a direction.
- Regional and segment averages: where inventory, or a segment, was sitting longer or shorter in this snapshot.
- Comparable competing units in your buyers' shopping area: whether a specific unit needs action. That area may reach beyond your county if your buyers travel.
Problems start when one level is used to answer another level's question.
How to review your own units
- Define comparable units precisely. Match on segment, new or used, brand, model, floorplan, model-year range, size and condition. Count only units listed where your buyers actually shop.
- Flag units that meet any of three conditions. The unit is older than comparable active listings; it's priced above comparable alternatives; or it faces increasing competition, with more comparable units being listed nearby.
- Review each flagged unit's positioning, then pick an action. Check its price, photos and listing quality against the comparables. Then choose: reprice, hold, transfer, wholesale, or adjust reorders.
- Treat competitor discounts as a reason to investigate, not an instruction to cut. If comparable units have been repriced, find out why first. A model-year closeout, an aged unit or a local overstock calls for a different response than a genuine shift in market value.
- Recheck regularly. This is one month's snapshot, and inventory conditions change.
How Rapidious Titan helps
Rapidious Titan tracks RV dealer inventory across 2,600+ U.S. rooftops, refreshed every 24 hours. It shows how long inventory has been sitting by segment and region, which comparable units are listed in your market area, and how their prices are changing. That makes it clear which of your units need a pricing or stocking decision, and why.
Get your personalized report
Frequently asked questions
Does days on lot show how fast RVs sell in my region? No. It's the average age of units still in inventory. Selling speed needs time-to-sale data from units that actually sold.
Should I compare my days on lot with the national average? As context only. In September 2026, regional averages ranged from about 160 to 177 days, while Class A ranged from about 134 to 223 days across regions. For a single unit, compare it with similar competing units where your buyers shop.
Source: Rapidious Titan data, September 2026 snapshot. Approximately 195,000 units in U.S. dealer inventory tracked by Rapidious Titan across four regions. Days on lot is the number of calendar days a unit has been publicly listed for sale, counted to the latest data date for units still for sale; new and used combined, inventory-weighted across segments. Figures rounded.
RV Market Intelligence, Delivered Weekly.
Actionable insights on pricing shifts, inventory velocity, competitive positioning built from market derived intelligence.








-
Heading 2
Heading 3
Heading 4
Lorem ipsum dolor sit amet, consectetur adipiscing elit, sed do
Ordered list
Unordered list
Text link
Bold text
Emphasis
-