

.avif)
In today’s U.S. RV dealership market, prices shift daily and buyer sentiment changes overnight. Knowing how fast RVs sell once listed - your market velocity - can make or break your dealership’s profitability.
For 2025, it’s no longer about having the biggest RV lot. It’s about having the fastest-moving inventory - and that’s where RV market velocity becomes your most valuable data point.
What Is Market Velocity in the RV Industry?
Market velocity measures how quickly an RV sells after being listed. Think of it as the speed of demand in your local or regional market.
- High velocity: RVs sell within 30–45 days- these units move fast and maintain pricing power.
- Low velocity: Units sit beyond 120+ days, tying up floorplan capital, losing value, and eroding margins.
Market velocity gives RV dealers a real-time read on demand - not based on OEM predictions or assumptions, but actual sales behavior across U.S. listings.
Why Market Velocity Matters More Than Ever in 2025
Inventory Aging Hurts More Than Ever
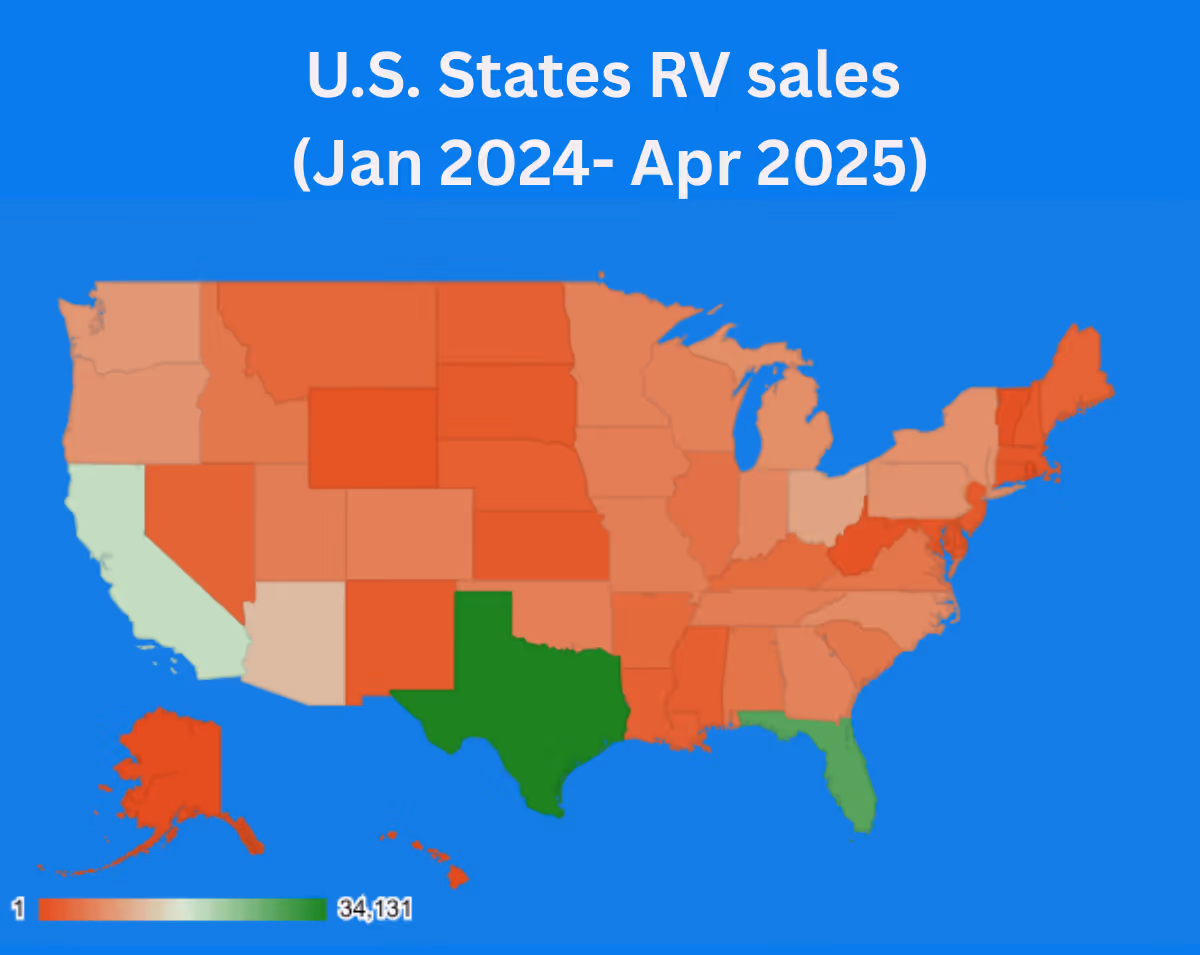
Rapidious Titan.AI analysis of U.S. RV data (Jan 2024 - Apr 2025) reveals:
- RVs with average inventory age under 45 days often sell near list price.
- Units that age beyond 120 days typically require 10–15% price cuts before selling.
That difference directly impacts your margins - and your dealership’s financial health.
Popularity Doesn’t Equal Performance
Many RV dealers assume a “hot-selling” model will keep performing well. But data shows otherwise.
A model that flew off the lot last season can age twice as long this year if regional demand softens.
Without tracking velocity data by make, model, and region, it’s easy to mistake “popular” for “profitable.”
Velocity Predicts Pricing Power
Fast-moving RV models maintain stronger prices. Slow movers force you into steeper discounts.
By analyzing sales velocity across states or ZIP codes, dealers can anticipate demand shifts early, and adjust pricing before competitors flood the listings with markdowns.
How Dealers Can Leverage Velocity Insights
Dealers using Rapidious Titan.AI apply velocity data in four ways:
- Benchmark every unit against national and regional averages before buying
- Rank inventory by age and price-to-market to identify early slow movers
- Use rolling 90-day velocity data instead of single-month snapshots for truer demand signals
- Match stocking volume to market speed - keep high-velocity models flowing and scale back on slow movers
Tools for Tracking RV Market Velocity - And Where Each Falls Short
Here is how dealers are currently reading market velocity - and where each approach creates blind spots:
How Rapidious Titan.AI Surfaces Market Velocity for RV Dealers
Market velocity only becomes actionable when it is specific - to the model, the region, and the current moment. Generic averages or past-season data tell a dealer what happened, not what is happening. Rapidious Titan.AI provides the live velocity picture dealers need to act before inventory ages.
- Velocity benchmarks by model and region - showing how fast comparable units are moving in your specific market, updated continuously rather than monthly
- Early slow-mover signals at the VIN level - so units trending behind their velocity benchmark are flagged before they cross the thresholds where margin recovery becomes difficult
- Regional demand context that shows where a model is moving fast versus where supply saturation is suppressing turns - so stocking decisions reflect local market reality, not national averages
Market velocity is the clearest early warning signal a dealer has. Rapidious Titan.AI makes it visible in real time, at the unit level, across local, regional, and national markets.

.svg)


-
Heading 2
Heading 3
Heading 4
Lorem ipsum dolor sit amet, consectetur adipiscing elit, sed do
Ordered list
Unordered list
Text link
Bold text
Emphasis
-