



Where Does Your Lot Actually Stand?
Listed value and real selling price aren't the same. See if your lot is overpriced, underpriced or sitting for longer than it should be.
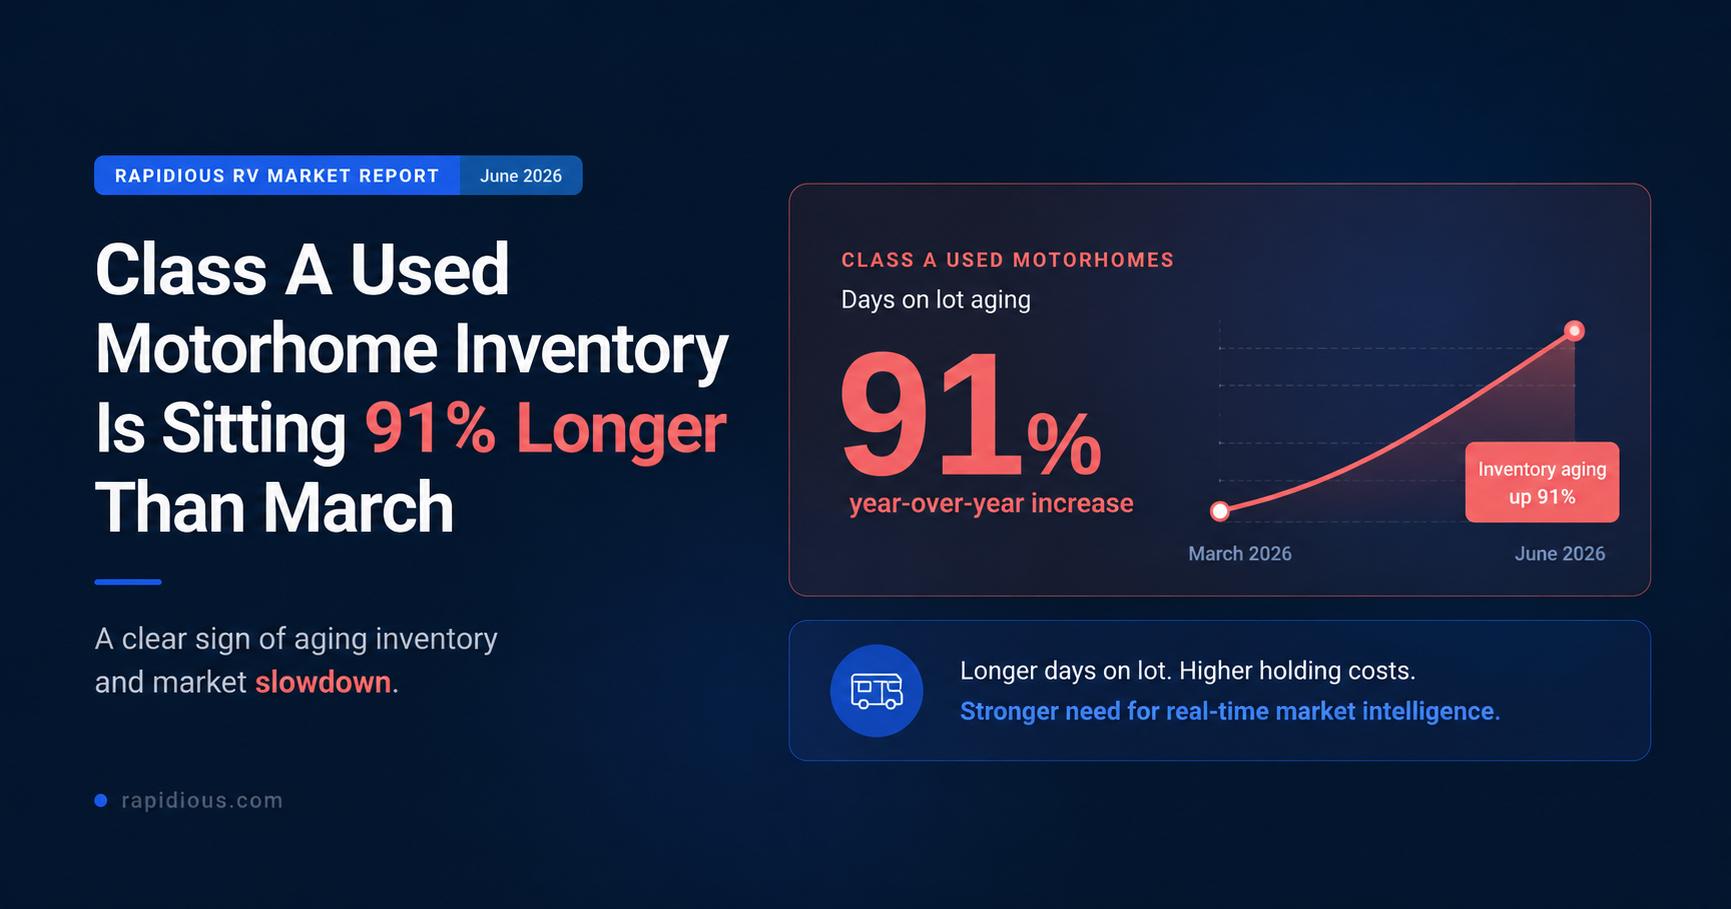
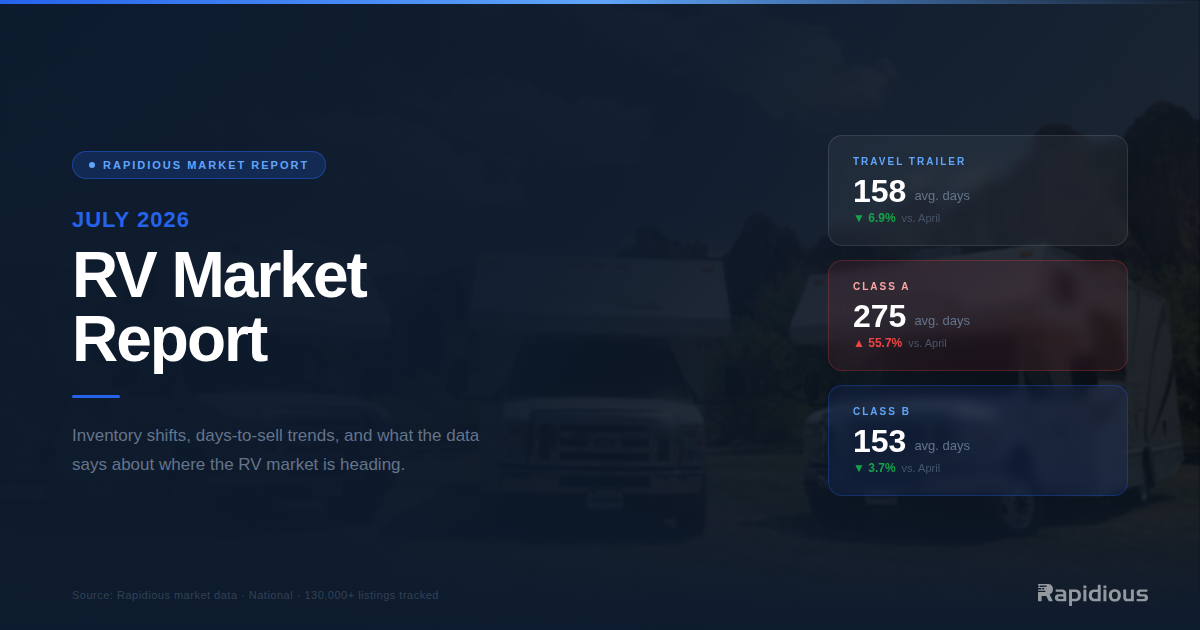
Of all the segments Rapidious Titan.AI, a real-time RV market intelligence platform, tracks across US dealer lots, Class A used motorhomes showed the sharpest deterioration between March and June 2026. Average days on inventory rose from 172 days in March to 330 days in June, a 91% increase in a single quarter. Inventory count grew from 8,368 to 12,320 units over the same period.
What the Numbers Are Actually Saying
Sold count did not collapse. Class A used moved 2,155 units in March and 2,374 in June, slightly more units sold. But inventory grew by 3,952 units over the same period. The problem is not that buyers disappeared. The problem is that pricing has not kept pace with where the market has moved.
A unit at 172 days on lot in March was still within a window where a moderate price adjustment could move it without major margin loss. A unit at 330 days has crossed into territory where the only remaining lever is often a steep discount, the kind that erases months of carrying cost in a single transaction. This pattern compounds. Units that age past 180 days accumulate floorplan interest, take up lot space that could turn over with fresher inventory, and require deeper markdowns the longer they remain unsold.
What This Looks Like at the Model Level
The unit-level data from Rapidious Titan.AI shows the pressure in specific model configurations. The units that are moving are moving in approximately 125 days. The units that are not are dragging the segment average to 330 days. The gap between those two outcomes is almost always a pricing decision made, or not made, earlier in the unit's time on lot.
What This Means for Dealers
The Class A used numbers are a timing argument above everything else. When a segment ages this fast, the dealers who protect margin are the ones repricing to the live market early, before the cost of waiting makes the decision for them.
What This Means for OEMs
When inventory ages this quickly and this broadly, the dealers who come out with margin intact are the ones who knew where the market was moving before the unit crossed 180 days. That requires a live read on the market, not a lagging one.
Data sourced from Rapidious Titan.AI, a real-time RV market intelligence platform. Based on U.S. dealer inventory tracked daily through June 2026.
RV Market Intelligence, Delivered Weekly.
Actionable insights on pricing shifts, inventory velocity, competitive positioning built from market derived intelligence.
.svg)