Have a question?

Ask about pricing, appraisals, or how Rapidious Titan works for your rooftops. We'll get back to you within 24 hours.

Pricing questions specific to your lot

Help reading your inventory benchmarks

Getting up Rapidious Titan for your rooftops

Anything else you're not sure who to ask

2,600
+

dealer rooftops monitored

$
14.4
B+

in live retail inventory

$
47.9
B+

in RV sales tracked

Takes 30 seconds
Thank you! Your submission has been received!
Oops! Something went wrong while submitting the form.
See what your inventory is actually worth
Bring a few units from your lot and we'll show you what the real market data says.
Thank you! Your submission has been received!
Oops! Something went wrong while submitting the form.

In 30 minutes, we'll pull your real stock numbers and match them

Book a Call

Published

July 30, 2026

RV Segments Showing Improvement in June 2026

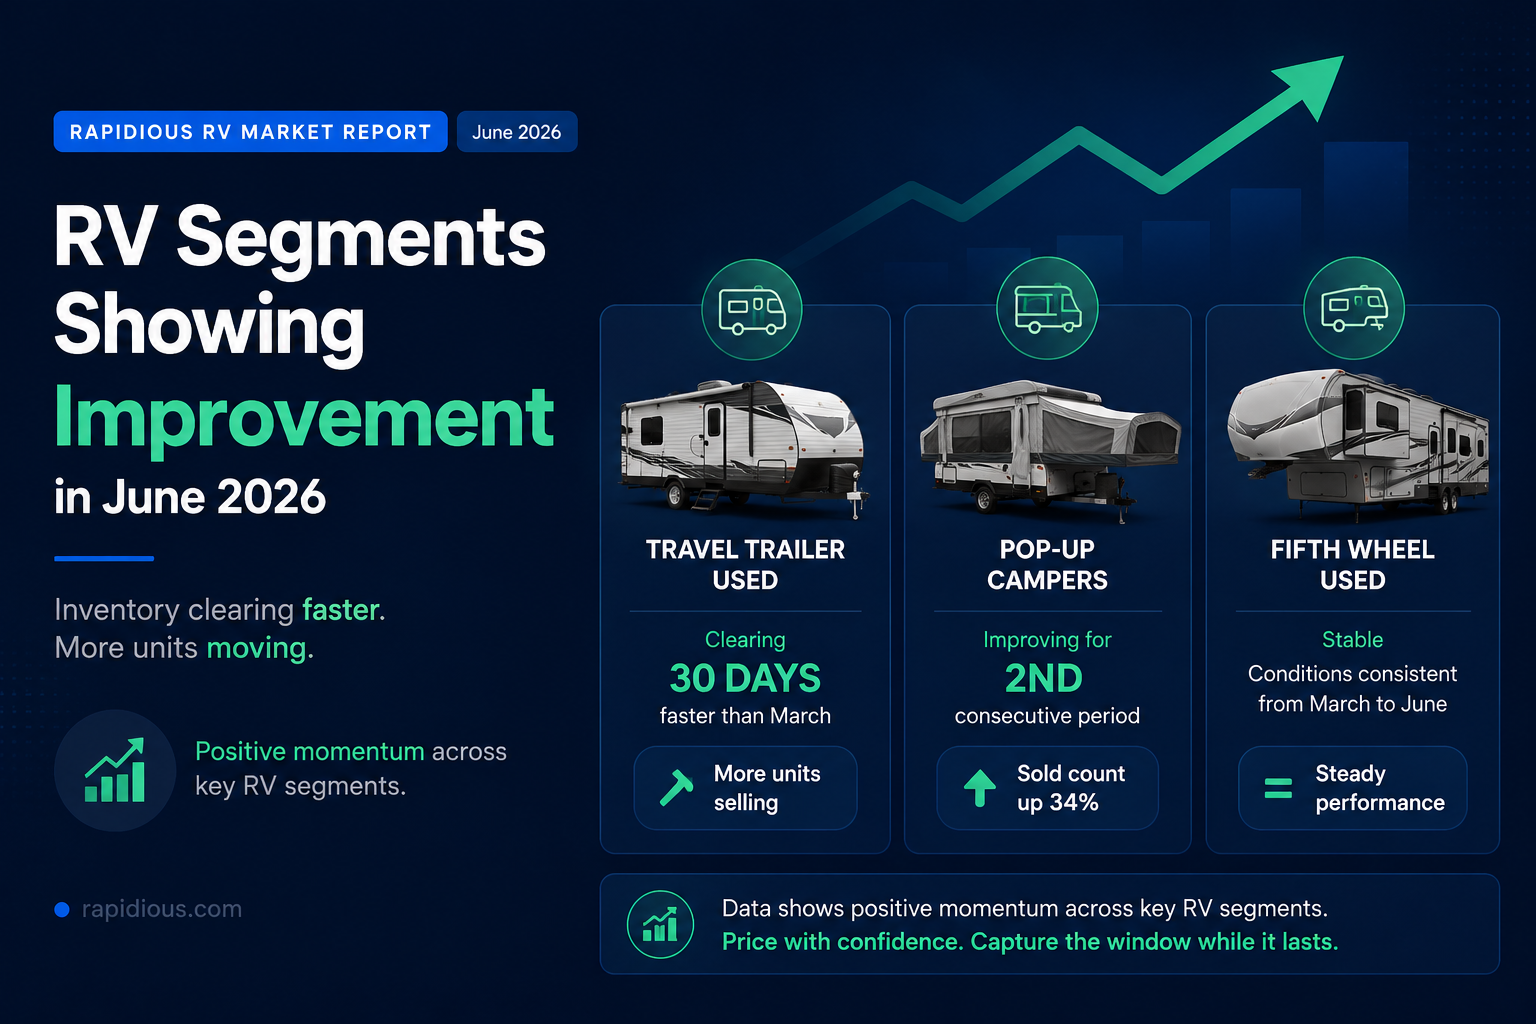
Rapidious Titan June 2026 data shows travel trailer used inventory days on lot fell from 182 to 152 days while units sold rose from 11,948 to 14,441. Pop-up campers improved for the second consecutive period with sold count up 34%. See which segments dealers should price confidently right now.

Deeksha Makhija, Brand Storyteller and Marketing Lead at Rapidious

Deeksha Makhija

Rapidious RV Segments Showing Improvement June 2026 thumbnail with green upward trend arrow and segment performance metrics

Summarize with AI

Table of Contents

Listings don't tell the whole story

Rapidious checks every listing and every sale in the country, every day. See what's actually selling near you, and what your competitors are really doing.

Book a demo
20 minutes. We'll pull up your own inventory live.

The Core Finding

Not all segments are under pressure. The data from Rapidious Titan, a real-time RV market intelligence platform, shows travel trailer used, pop-up campers, and fifth wheel used all showing stable or improving conditions between March and June 2026. For dealers carrying inventory in these categories, the data supports confident pricing right now.

‍Travel Trailer Used: Improving on Both Metrics

Travel trailer used days on inventory improved from 182 days to 152 days, units clearing 30 days faster than in March. Sold count rose from 11,948 to 14,441, more units selling and selling faster at the same time. When both velocity and volume improve simultaneously, it confirms real demand, not a statistical artifact.

Pop-Up Campers: Consistent Improvement

Pop-up campers improved from 180 days to 163 days, with sold count rising from 443 to 593, a 34% increase. This is the second consecutive data period showing improvement. Consistency across two periods makes this a more reliable signal than a one-time reading. The market is actively buying pop-up campers right now.

Fifth Wheel Used: Holding Steady

The fifth wheel used is the most stable major segment in the June 2026 dataset. Days on inventory moved only marginally from 180 to 176 days. Sold count increased from 3,030 to 3,741. This is a segment that is not under the same pressure as Class A used, and where conditions have remained broadly consistent.

‍

All Three Segments: Side by Side

Segment March—Inv Days June—Inv Days Change March Sold June Sold Signal
Travel trailer used 182 days 152 days -30 days 11,948 14,441 Improving
Pop-up Camper all 180 days 163 days -17 days 443 593 Improving (2nd period)
Fifth Wheel used 180 days 176 days -4 days 3,030 3,741 Stable

‍

What Dealers Should Do

Segment What the data says Action for dealers
Travel trailer used Clearing 30 days faster than March.
More units selling.
Price with confidence. This is not the time to discount preemptively.
Pop-up campers Improving for the second consecutive period. Sold count up 34%. Price into demand while the window holds. Discounting by habit leaves margin behind.
Fifth Wheel used Stable. Conditions consistent from March to June. Hold steady. Major price reductions are not warranted by the data.
All three segments Regional calibration still matters even in strong segments. Use your state velocity data alongside segment data. A strong segment in a slow state still moves at that state's pace.

‍

Travel trailers and pop-up campers are two of the few segments in the June 2026 data where dealer pricing has room to hold firm. Acting on that room now, while both velocity and volume are improving, is where margin gets protected rather than surrendered to habit.

‍

What This Means for OEMs

The improvement in travel trailer used and pop-up campers, measured against a backdrop of Class A used deterioration, suggests the market is making clear segment-level choices. Allocation and production decisions that weight these segments accordingly and pull back on Class A relative to recent production rates are what the retail data from Rapidious Titan supports right now.

When two segments are improving while a third deteriorates sharply, the market is telling OEMs something specific about where production and support should go. Rapidious Titan surfaces that signal at the retail level before it reaches wholesale metrics.

‍

Data sourced from Rapidious Titan, a real-time RV market intelligence platform. Based on U.S. dealer inventory tracked daily through June 2026.

See exactly what's sitting, stalling, and costing you.

Drop your details and we'll pull a snapshot of your inventory against live market data; then walk you through it on a quick call.

No prep needed · we analyze your lot · 30-minute call
Pulling your lot details…

Almost there.

You're on the list.

We've pulled your inventory data before we connect so when we talk,
we're looking at your actual units, your pricing gaps, and what's aging on your lot.

Redirecting to book a free inventory pricing snapshot call in 3 seconds...
Oops! Something went wrong while submitting the form.

Previous RV Market Reports

Monthly pricing, inventory velocity, and aging data across the U.S. and Canadian RV market. Every report is built from the same 265,000+ live listings, tracked daily.

Link successfully copied