Reporting period: July 2026
Comparisons: April 2026 & 60-day trailing
Coverage: New & used · all classes · 50 states
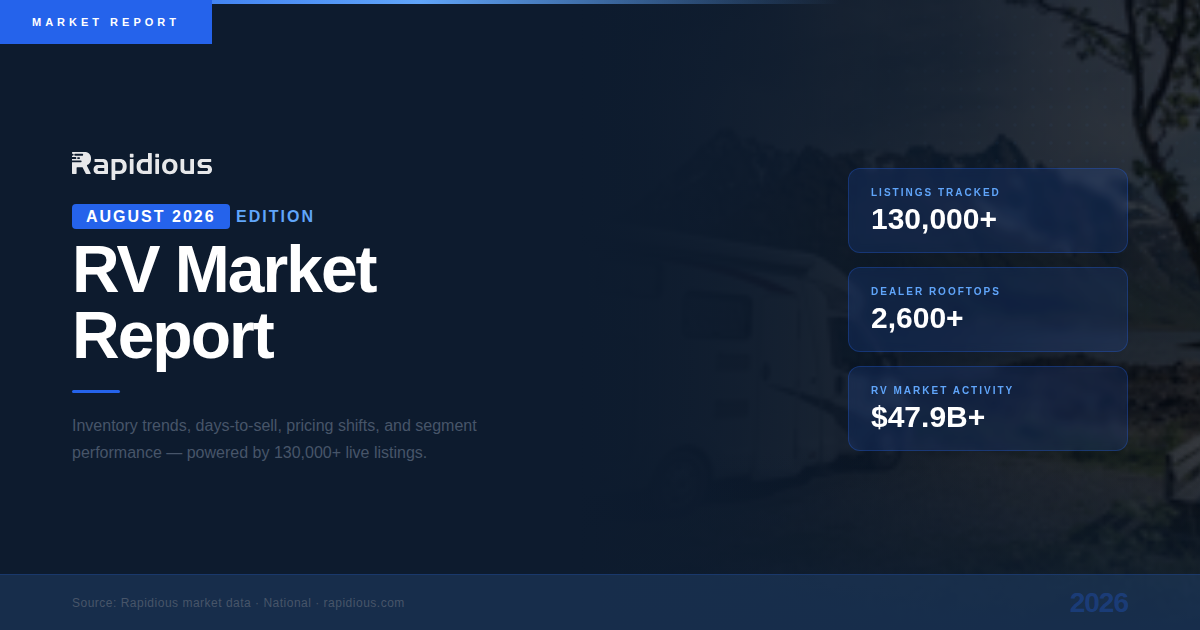
2,600+
Rooftops
Dealer rooftops monitored
$14.4B+
Inventory
Live retail inventory tracked
$47.9B+
Sales
RV sales tracked
50
States
Covered in this report
What are the average RV days-to-sell benchmarks for July 2026?
The average time to sell an RV in July 2026 varies significantly by class, with Fish Houses turning fastest in 80 days and Park Models taking up to 207 days. Most standard towables cluster between 155 and 175 days, suggesting that pricing and stock freshness are the primary drivers of velocity in the current market.
Average days to sell — July 2026, by class (fastest to slowest)
| Class |
Days to Sell |
Notes |
| Fish House | 80 | Fastest turn on the lot — niche supply |
| Class B+ | 111 | Compact vans clear quickly |
| Expandable Trailer | 133 | — |
| Class B | 142 | — |
| Overland Camper | 143 | — |
| Pop-up Camper | 146 | — |
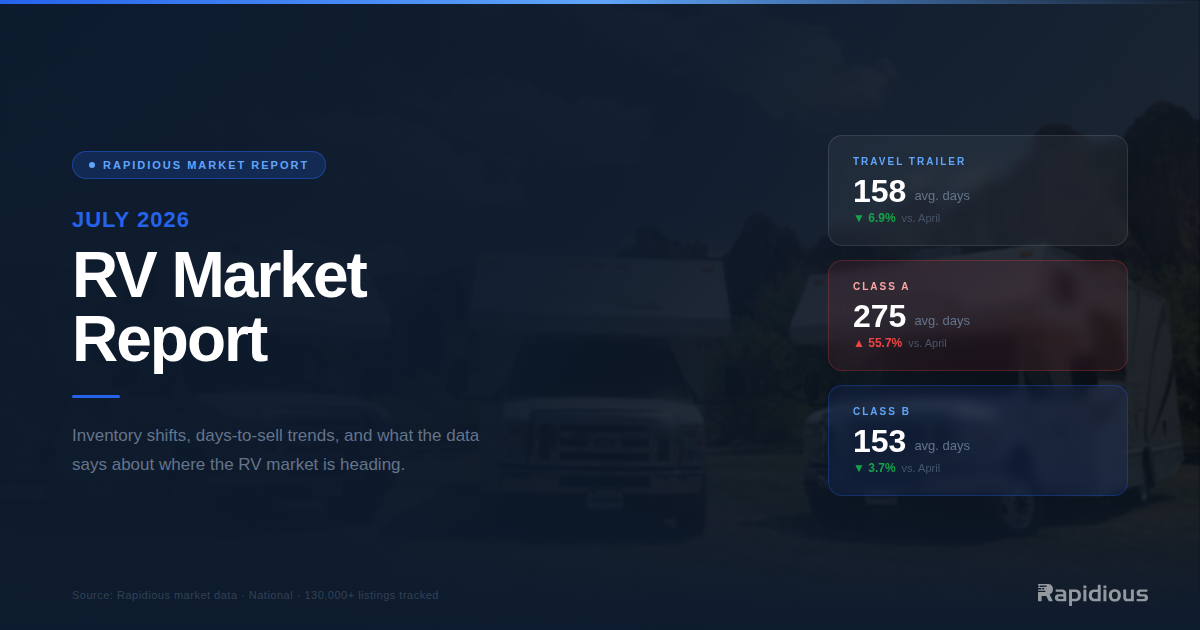
| Class A | 156 | Sells okay — but stale units skew the lot (see §4) |
| Truck Camper | 157 | — |
| Travel Trailer | 158 | The volume king — 36,217 sold in July |
| Class C | 160 | — |
| Fifth Wheel | 162 | — |
| Toy Hauler (Travel) | 164 | — |
| Teardrop Trailer | 171 | — |
| Toy Hauler (Fifth) | 174 | — |
| Destination Trailer | 178 | — |
| Park Model | 207 | Nearly 7 months to move — behaves like real estate |
Two things stand out. First, the towables cluster tightly in the 155–175 day band — there is no easy turn in the trailer aisle, so the money is made on how you price and how fresh you keep the stock, not on which floorplan you pick. Second, the extremes are niche: Fish Houses and Class B+ vans clear quickly on thin supply, while Park Models and Destination Trailers behave like real estate, not vehicles.
RAPIDIOUS TITAN
Why it matters for your lot:
a class average is a starting line, not a verdict. Rapidious Titan benchmarks each unit against days-to-sell for its exact year, make, model, and trim — so a 120-day-old travel trailer reads as “on pace” while a 120-day-old Park Model reads as “act now.”
Are used RVs selling faster than new units in 2026?
Used RVs are currently selling 32% to 49% faster than new units across every major class as buyers prioritize value over new features. The widest demand gap is seen in Toy Haulers and Fifth Wheels, where used inventory moves over 80 days faster than new factory stock.
Days to sell and the new-vs-used gap, July 2026
| Class |
New |
Used |
Gap (Days) |
Used Advantage |
| Toy Hauler (Fifth Wheel) | 225 | 114 | −111 | Used 49% faster |
| Fifth Wheel | 198 | 112 | −86 | Used 43% faster |
| Class C | 201 | 119 | −82 | Used 41% faster |
| Travel Trailer | 185 | 114 | −71 | Used 38% faster |
| Class A | 204 | 137 | −67 | Used 33% faster |
| Class B | 162 | 110 | −52 | Used 32% faster |
The read.
When used clears in half the time of new, the risk isn’t your pre-owned lot — it’s the new units bought against last year’s demand curve. The dealers protecting margin this summer are the ones taking clean trades aggressively and turning them fast, while pricing new inventory to move rather than to hold.
RAPIDIOUS TITAN
Why it matters for your lot:
the new-vs-used gap is exactly where appraisal discipline pays. Rapidious Titan values every trade against live retail comps and projected days-to-sell, so you can bid confidently on the used units that turn — and avoid over-stocking new floorplans the market is aging.
Which U.S. states have the best RV sales performance in July 2026?
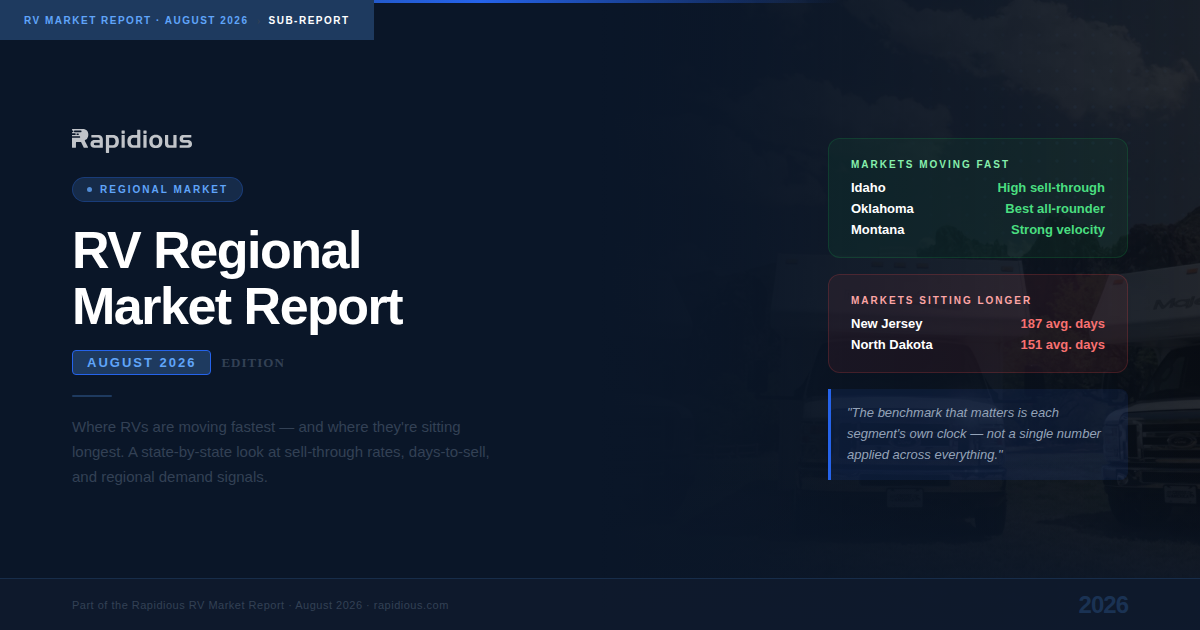
Virginia and Montana currently lead the U.S. market with sell-through rates of 50.9% and 41.7%, respectively. Texas remains the strongest high-volume market, efficiently turning over 20,000 units in an average of 128 days despite its massive scale.
Strongest markets — highest sell-through
| State | Region | Sell-Through | Days to Sell |
|---|
| Virginia | South | 50.9% | 183 |
| Montana | West | 41.7% | 140 |
| Idaho | West | 41.0% | 133 |
| New Jersey | Northeast | 40.6% | 187 |
| Delaware | South | 39.7% | 176 |
| Oklahoma | South | 39.3% | 144 |
| Texas | South | 38.0% | 128 |
Softest markets — where units sit
| State | Region | Sell-Through | Days to Sell |
|---|
| Nebraska | Midwest | 11.6% | 174 |
| South Dakota | Midwest | 17.3% | 162 |
| Louisiana | South | 18.0% | 171 |
| Arizona | West | 20.1% | 152 |
| Wyoming | West | 21.8% | 174 |
| Kansas | Midwest | 23.2% | 221 |
| Ohio | Midwest | 33.3% | 227 |
Texas is the market to watch.
Texas carries the most inventory in the country (20,439 units) and still turns it in 128 days — the fastest of any high-volume state — at a healthy 38% sell-through. Scale and speed rarely travel together; here they do. Ohio is the cautionary opposite: heavy inventory (9,944 units) sitting an average of 227 days.
RAPIDIOUS TITAN
Why it matters for your lot:
national averages hide where your demand actually is. Rapidious Titan reports sell-through and days-to-sell down to state, region, and unit class — so multi-location groups can shift the right floorplans to the right rooftops instead of guessing.
Is Class A RV inventory aging too long on dealer lots?
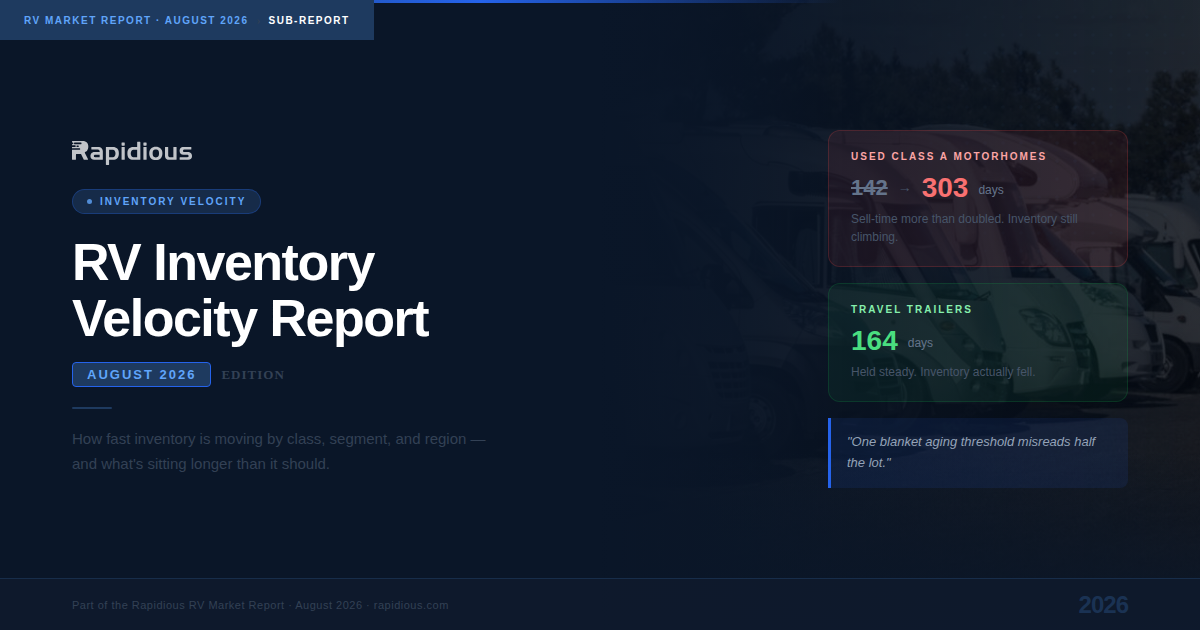
Class A inventory is facing a critical aging gap, with on-lot units now 76% older than the units actually selling. While buyers are selecting units averaging 156 days, the remaining lot inventory has swelled to a 275-day average, signaling a significant mismatch in product mix.
Aging gap by class — how much older on-lot inventory is than what’s selling (July 2026)
| Class | Aging Gap | Notes |
|---|
| Class A | +76% | On-lot avg 275 days vs. 156 for what sold — the gap doubled since April |
| Overland Camper | +55% | — |
| Park Model | +26% | — |
| Class C | +17% | — |
| Fifth Wheel | +6% | — |
| Travel Trailer | −0.2% | On-lot and selling stock in sync — healthy |
| Truck Camper | −0.4% | Turning cleanly, no aging tail |
The Class A story is the one to act on. In April, the average motorhome on a lot was about 40% older than the ones selling — already a warning. By July that gap hit 76%: lots are averaging 275 days of Class A stock while buyers are picking units at 156. That’s not a demand problem, it’s a mix problem — the wrong Class A units are accumulating, and every week widens the gap. Towables, by contrast, are boringly healthy: what’s on the lot looks like what’s selling.
RAPIDIOUS TITAN
Why it matters for your lot:
the aging gap is invisible until a unit is 200 days old and un-sellable at margin. Rapidious Titan flags stagnant units by age band before they cross the line, so you can re-merchandise, re-price, or wholesale while the unit still has room.
Which RV models are experiencing oversupply in 2026?
The Jayco Jay Flight SLX 261BHS and Forest River Aurora 27DBH are currently showing the fastest inventory builds, with increases of over 100 units in the last 60 days. This growth is primarily driven by incoming 2027 model-year stock, creating a potential oversupply risk for entry-level travel trailers.
Largest 60-day inventory increases by model — new units
| Make & Model |
Year |
Units Now |
60d Ago |
Change |
Median Price |
| Jayco Jay Flight SLX 261BHS | 2027 | 153 | 41 | +112 | $28,999 |
| Forest River Aurora 27DBH | 2027 | 103 | 0 | +103 | $33,995 |
| Palomino Puma 220FK | 2026 | 93 | 1 | +92 | $32,887 |
| Jayco Jay Flight SLX 170BH | 2027 | 115 | 24 | +91 | $15,773 |
| Dutchmen Eddie Bauer 3210RL | 2026 | 85 | 0 | +85 | $70,238 |
| Grand Design Imagine XLS 25RLE | 2026 | 82 | 11 | +71 | $38,989 |
| Grand Design Transcend One 151BH | 2027 | 116 | 47 | +69 | $17,995 |
Incoming stock, not dead stock — yet.
These units carry low on-lot age, so the build-up is fresh model-year arrivals, not stagnation. The risk is downstream: with new travel trailers already averaging 185 days to sell (§2), a wave of near-identical entry floorplans landing at once is exactly the setup that turns into next quarter’s aging problem. Price and merchandise them like the clock is already running.
RAPIDIOUS TITAN
Why it matters for your lot:
Rapidious Titan tracks unit-level inventory and age movement across 2,600+ rooftops, so you see how many of the same floorplan the market is absorbing — and how fast — before you commit your next new-unit order.
Are current RV asking prices aligned with the market?
Current pricing data shows a split market where premium motorhomes like the Coachmen Galleria are listed $3,489 above closing prices, while older 2025-26 stock is being discounted below market. Dealers are increasingly forced to trim margins on aging floorplans to compete with incoming 2027 inventory.
Asking price vs. market — selected new floorplans, July 2026
| Make & Model |
Median Asking |
Market Price |
Gap |
Position |
| Coachmen Galleria 24Q | $135,415 | $131,927 | +$3,489 | Above market |
| Grand Design Reflection 360FLS | $68,430 | $66,827 | +$1,603 | Above market |
| Forest River Cedar Creek 40CBK | $72,019 | $73,300 | −$1,281 | Below market |
| Keystone Alpine 3910RK | $79,995 | $83,526 | −$3,531 | Below market |
Two behaviors are showing up side by side. Some units — often lower-supply motorhomes and premium fifth wheels — are still listed above closing prices, betting on a patient buyer. Others, especially 2025–26 units competing with fresh 2027 arrivals, have already been marked below market to move. The Coachmen Galleria is a telling case: it sat below market in June and flipped to +$3,489 above by July — a pricing decision, not a market move, and the kind of drift that quietly adds days on the lot.
RAPIDIOUS TITAN
Why it matters for your lot:
“priced right” isn’t a hunch — it’s your asking price against live closings for the same year, make, model, and trim. Rapidious Titan surfaces that gap on every unit, so you know when to hold, when to trim, and exactly how far before a price change becomes a giveaway.
See your lot in this data
This report is the market at a glance. Rapidious Titan puts the same intelligence on your own inventory- every unit benchmarked for price, velocity, and aging in real time.
Book a Rapidious Titan demo
Enjoyed reading it, Spread the word!
https://www.rapidious.com/market-intelligence-reports/july-2026-rv-market-report







.svg)