

Have a question?

Ask about pricing, appraisals, or how Rapidious Titan.AI works for your rooftops. We'll get back to you within 24 hours.

Pricing questions specific to your lot

Help reading your inventory benchmarks

Getting up Rapidious Titan.AI for your rooftops

Anything else you're not sure who to ask

2,600
+

dealer rooftops monitored

$
14.4
B+

in live retail inventory

$
47.9
B+

in RV sales tracked

Takes 30 seconds
Thank you! Your submission has been received!
Oops! Something went wrong while submitting the form.
Justin Marvin, Co-Founder and SVP at Rapidious
See what your inventory is actually worth
Bring a few units from your lot and we'll show you what the real market data says.
Thank you! Your submission has been received!
Oops! Something went wrong while submitting the form.

In 30 minutes, we'll pull your real stock numbers and match them

Book a Call

Justin Marvin, Co-Founder and SVP at Rapidious

Published

August 31, 2026

Rapidious RV Inventory Velocity Report — August 2026

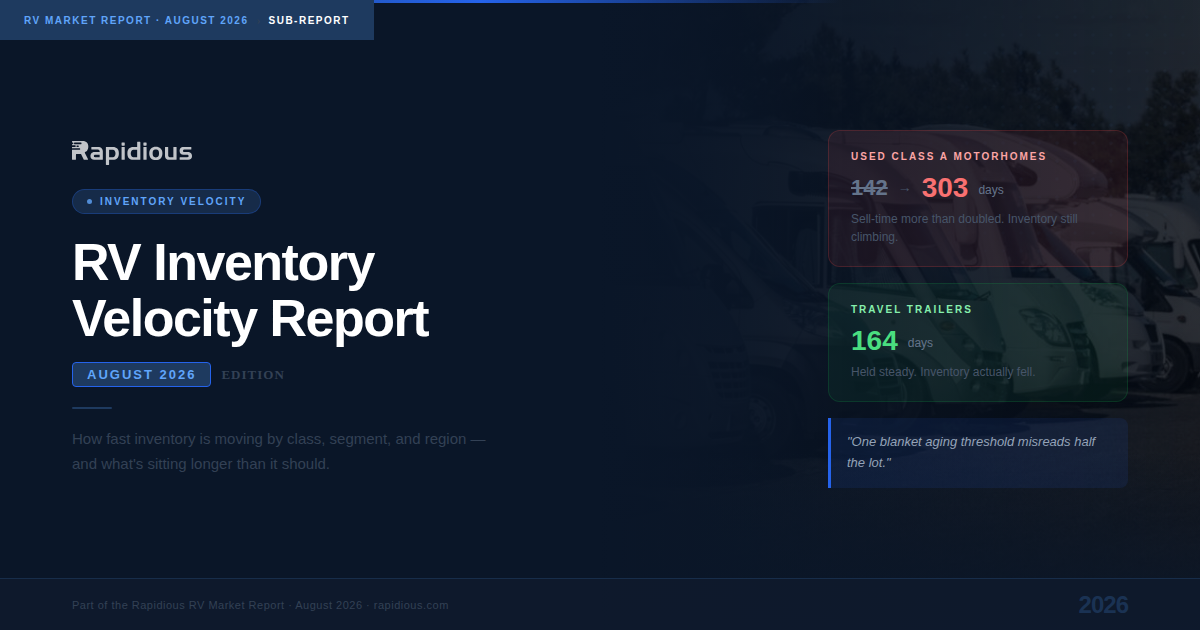
Between May and August 2026, RV sell-time split sharply by segment. Used Class A motorhomes more than doubled their time to sell — from 142 to 303 days — while inventory kept climbing, and travel trailers barely moved, holding near 164 days with inventory actually falling. The takeaway for dealers: one blanket aging threshold misreads half the lot. The benchmark that matters is each segment's own clock, not a single number applied across everything.

Rapidious logo, RV Market Intelligence

Rapidious Team

Bar chart comparing average RV days-to-sell by segment, May vs. August 2026 — used Class A motorhomes jump from 142 to 303 days while travel trailers hold near 164 days.

Summarize with AI

Table of Contents

Listings don't tell the whole story

Rapidious checks every listing and every sale in the country, every day. See what's actually selling near you, and what your competitors are really doing.

Book a demo
20 minutes. We'll pull up your own inventory live.

Key Finding

According to Rapidious Titan.AI data, RV sell-time diverged sharply by segment between May and August 2026: motorhomes slowed dramatically while towables held their pace. Used Class A motorhomes went from selling in 142 days to 303 days in a single quarter, and the average used Class A on a dealer lot had been sitting 337 days by August. Trailers, by contrast, barely moved — travel trailers held near 164 days and their inventory actually fell.

Sell-time by segment, May vs. August 2026

"Days to sell" is the average time-to-sale for units that sold in each month; "days-on-lot" is the average age of units still in inventory.

Segment Days to sell
May 2026
Days to sell
Aug 2026
Δ days Direction
Motorhomes
Class A motorhome 143286 +143 ▲ Doubled
Class B motorhome 137157 +20 ▲ Slower
Class C motorhome 168170 +2 ~ Steady
Towables
Travel trailer 168164 −4 ~ Steady
Fifth wheel 166180 +14 ▲ Slight rise
Toy hauler (travel trailer) 172164 −8 ▼ Faster
Compact & specialty
Pop-up camper 147140 −7 ▼ Faster
Truck camper 165133 −32 ▼ Faster
Fish house 127114 −13 ▼ Fastest-moving
Source: Rapidious Titan.AI data, May vs. August 2026.

The motorhome slowdown in detail

The Class A segment carried the slowdown. Used Class A units:

  • Days to sell: 142 (May) → 303 (Aug)
  • Days-on-lot in inventory: 334 (May) → 337 (Aug)
  • Inventory count: grew roughly 20% over the window

That combination — inventory rising while sell-time doubles — is the definition of accumulating faster than you sell. New Class A units slowed too, from about 146 to 212 days to sell.

Why segment matters more than a blanket number

A dealer applying one "aging" threshold across the lot will misread half of it. In August 2026, a fish house selling in 114 days was pacing normally for its segment, while a Class A at the same 114 days would have been a standout fast turn. The benchmark that matters is the segment's own clock, not a single number applied to everything.

Data & methodology: Rapidious Titan.AI market intelligence covering U.S. RV dealer inventory and sales, May–August 2026. Figures are segment averages across new and used units.

See exactly what's sitting, stalling, and costing you.

Drop your details and we'll pull a snapshot of your inventory against live market data; then walk you through it on a quick call.

No prep needed · we analyze your lot · 30-minute call
Pulling your lot details…

Almost there.

You're on the list.

We've pulled your inventory data before we connect so when we talk,
we're looking at your actual units, your pricing gaps, and what's aging on your lot.

Redirecting to book a free inventory pricing snapshot call in 3 seconds...
Oops! Something went wrong while submitting the form.

Link successfully copied