

Have a question?

Ask about pricing, appraisals, or how Rapidious Titan.AI works for your rooftops. We'll get back to you within 24 hours.

Pricing questions specific to your lot

Help reading your inventory benchmarks

Getting up Rapidious Titan.AI for your rooftops

Anything else you're not sure who to ask

2,600
+

dealer rooftops monitored

$
14.4
B+

in live retail inventory

$
47.9
B+

in RV sales tracked

Takes 30 seconds
Thank you! Your submission has been received!
Oops! Something went wrong while submitting the form.
Justin Marvin, Co-Founder and SVP at Rapidious
See what your inventory is actually worth
Bring a few units from your lot and we'll show you what the real market data says.
Thank you! Your submission has been received!
Oops! Something went wrong while submitting the form.

In 30 minutes, we'll pull your real stock numbers and match them

Book a Call

Justin Marvin, Co-Founder and SVP at Rapidious

Published

August 31, 2026

Rapidious RV Regional Market Report — August 2026

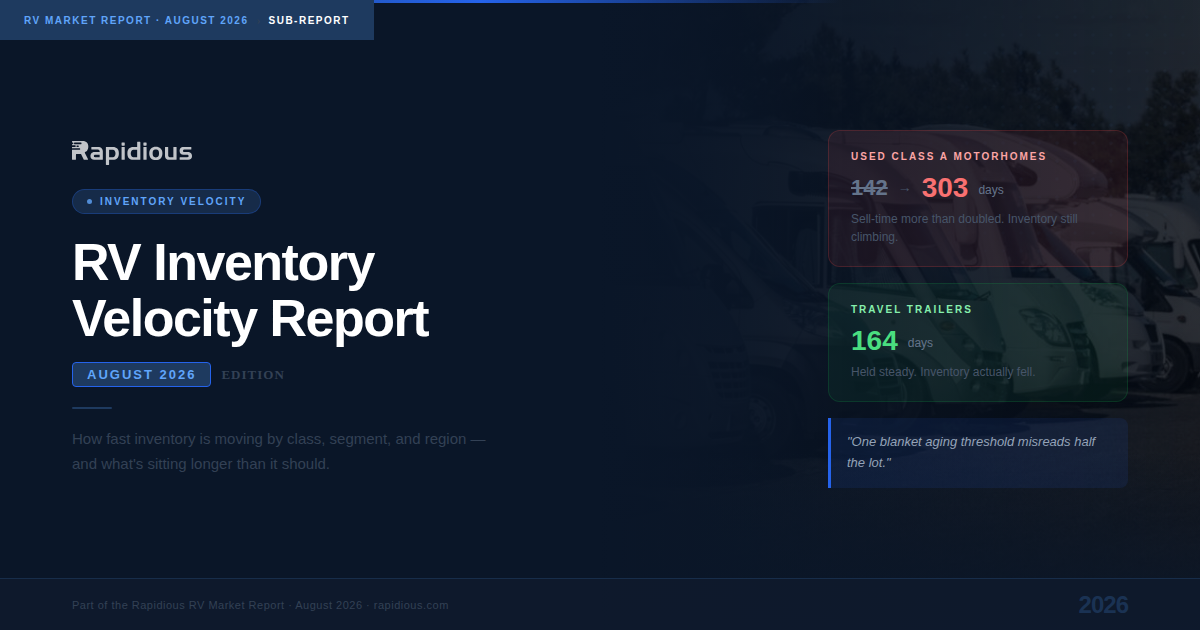
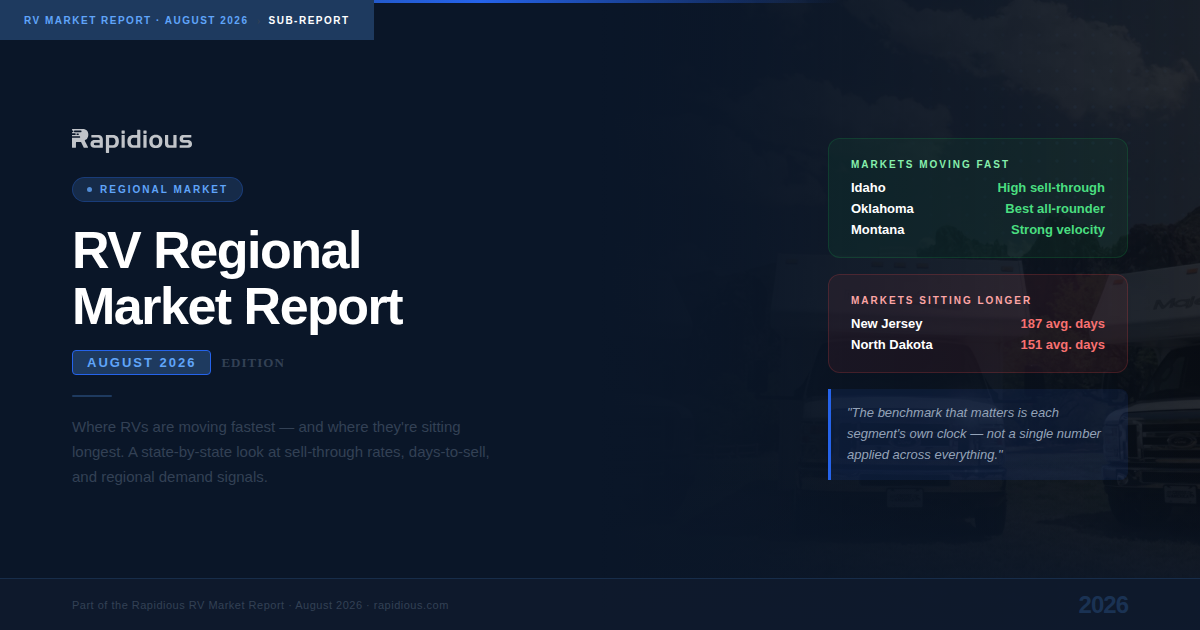
According to Rapidious Titan.AI- RV inventory velocity was defined by geography: average days-on-lot ranged from about 81 days in Nebraska to 382 in Alaska. The share of inventory turning "very slow" swung just as hard, from single digits in the quickest states to 40% in Florida and Alabama, while Texas- the largest market at 20,613 units, still saw more than a quarter of its inventory stalling despite a moderate 165-day average.

Rapidious logo, RV Market Intelligence

Rapidious Team

Bar chart showing RV inventory velocity by U.S. state in August 2026, with average days-on-lot ranging from 81 days in Nebraska to 382 in Alaska and "very slow" inventory share reaching 40% in Florida and Alabama.

Summarize with AI

Table of Contents

Listings don't tell the whole story

Rapidious checks every listing and every sale in the country, every day. See what's actually selling near you, and what your competitors are really doing.

Book a demo
20 minutes. We'll pull up your own inventory live.

Key Finding

According to Rapidious Titan.AI data, where an RV sits matters as much as what it is. In August 2026, average days-on-lot ranged from about 81 days in Nebraska to 382 in Alaska — a roughly 300-day gap between the fastest and slowest state markets. The share of inventory turning "very slow" swung just as hard, from single digits in the fastest states to 40% in Florida and Alabama. A national average describes a market no single dealer actually operates in.

Fastest and slowest state markets
State Days-on-lot, Aug 2026
Fastest Nebraska~81
Idaho~142
Missouri~169
Oregon~171
Slowest Arizona~229
Alabama~285
South Dakota~326
Alaska~382
Source: Rapidious Titan.AI data, August 2026. Very-small-inventory states excluded from the extremes.

Share of inventory turning "very slow"

Days-on-lot tells you the average; the "very slow" share tells you how much of a market is genuinely stuck.

State Total inventory Turning “very slow”
Florida 17,153 40%
Alabama 5,250 40%
Arizona 7,956 32%
California 13,226 29%
Texas 20,613 26%
Source: Rapidious Titan.AI data, August 2026.

Texas was the single largest market at 20,613 units and a moderate 165-day average — but even there, more than a quarter of inventory was turning very slowly. In Florida, four of every ten units were.

Why national data misleads a local dealer

A Class A motorhome that looks "aged" against a national benchmark might be pacing normally in a fast market like Idaho, or genuinely stuck in a slow one like Alabama. The same unit, the same price, two different verdicts — decided entirely by geography. That's why a dealer's pricing and stocking calls have to be read against their own regional market, not a national headline.

Data & methodology: Rapidious Titan.AI market intelligence, August 2026, covering U.S. RV dealer inventory and sales by state. "Very slow" reflects units in the slowest velocity tier as a share of state inventory. Extremes exclude states with negligible inventory.

See exactly what's sitting, stalling, and costing you.

Drop your details and we'll pull a snapshot of your inventory against live market data; then walk you through it on a quick call.

No prep needed · we analyze your lot · 30-minute call
Pulling your lot details…

Almost there.

You're on the list.

We've pulled your inventory data before we connect so when we talk,
we're looking at your actual units, your pricing gaps, and what's aging on your lot.

Redirecting to book a free inventory pricing snapshot call in 3 seconds...
Oops! Something went wrong while submitting the form.

Link successfully copied