





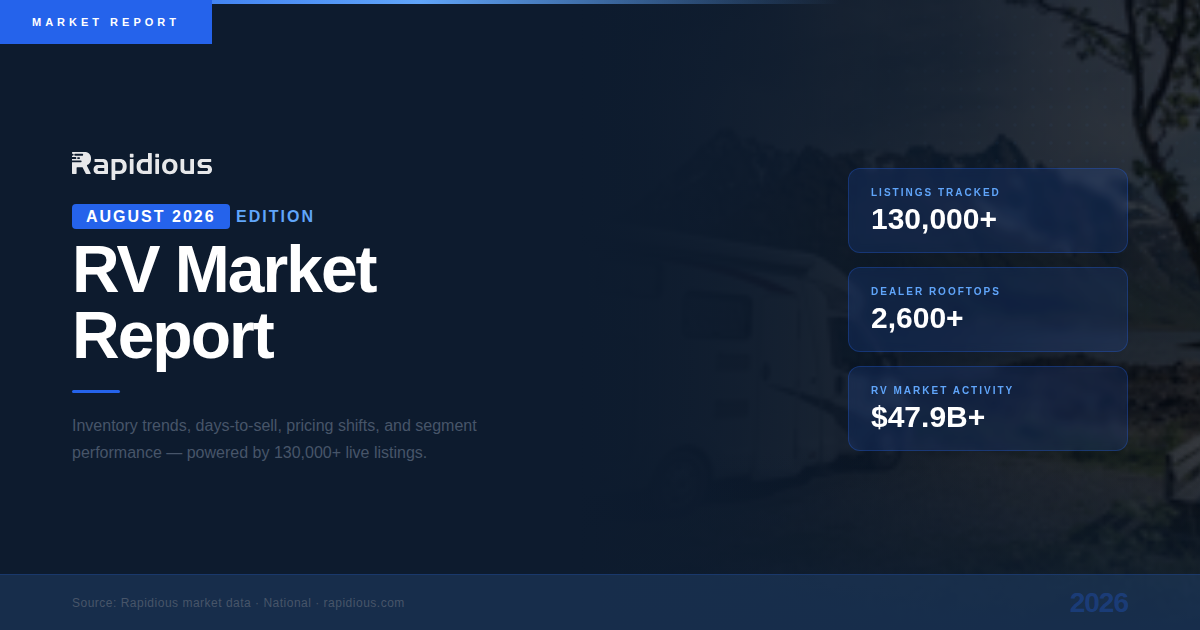
Listings don't tell the whole story
Rapidious checks every listing and every sale in the country, every day. See what's actually selling near you, and what your competitors are really doing.
Key findings
According to Rapidious Titan.AI data, the U.S. RV market split three ways in August 2026: motorhomes slowed sharply while towables held steady, half of all models were priced within 1% of market yet nearly a third sat below it, and where a unit sold mattered as much as what it was — days-on-lot ranged from about 81 days in the fastest state to 382 in the slowest. The through-line for dealers: a slow unit is now more often a demand-and-location problem than a price problem.
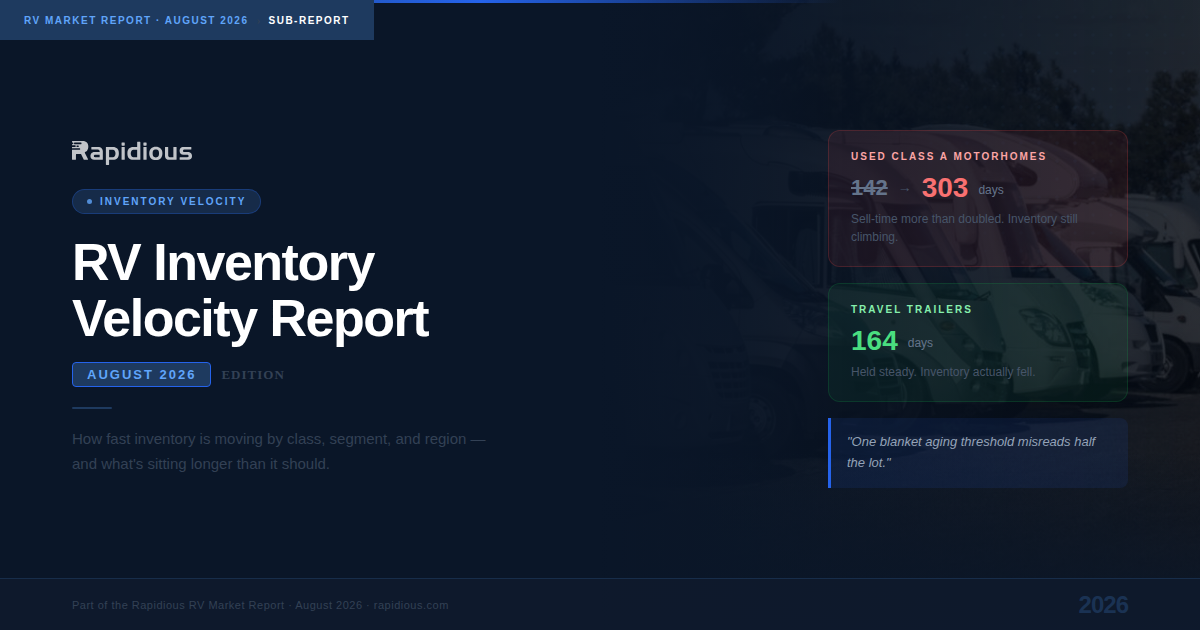
- Used Class A motorhomes took 303 days to sell in August, up from 142 in May — sell-time more than doubled in a quarter.
- Travel trailers held at ~164 days and their inventory fell, showing the slowdown is segment-specific, not market-wide.
- Across 4,173 model configurations, 50% were priced within 1% of market, 30% below (leaving margin unclaimed) and 20% above (suppressing demand).
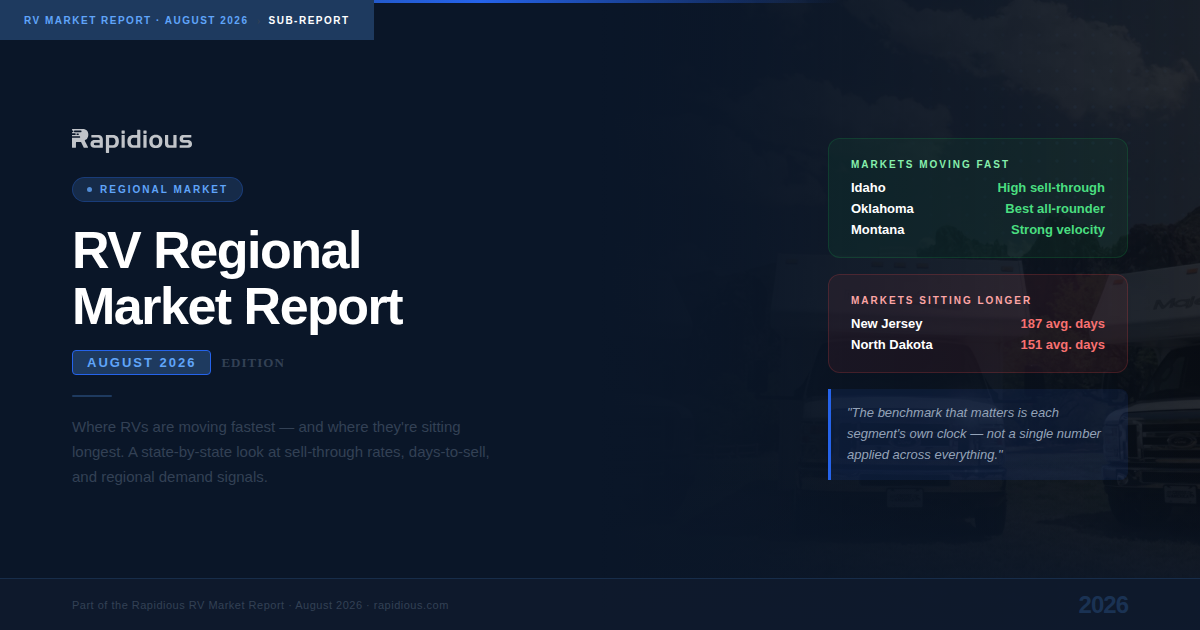
- RV days-on-lot spanned a ~300-day gap between the fastest and slowest states; in Florida, 40% of inventory was turning "very slow."
1. Velocity: motorhomes stalled, towables held
The clearest story of the summer was divergence by segment. Motorhomes — Class A especially — slowed hard, while trailers stayed close to their spring pace.
Used Class A units told the sharpest version of the story: the average one had been sitting 337 days on dealer lots in August, and even the ones that cleared took 303 days. Meanwhile Class A used inventory grew about 20% over the same window — dealers accumulating motorhomes faster than the market absorbed them.
2. Pricing: most units are close to market — but a third leave money on the table
Rapidious Titan.AI compared the median listing price against the median market price for 4,173 RV model configurations in July 2026. Most dealers are pricing close to the market — but the misses split in a revealing way.
Two problems hide inside those averages. The 20% priced above market are suppressing their own demand — the fastest way to turn a sellable unit into an aging one. The 30% priced below market, especially used units (37% of them), are giving away gross that the market would have paid. Underpricing doesn't show up as a problem, which is exactly why it goes unnoticed.
3. Region: national averages hide where a dealer actually stands
The same unit ages very differently depending on the lot it sits on.
What it means for dealers
Three takeaways follow directly from the data:
First, diagnose before discounting — in a segment as slow as Class A, a price cut rarely fixes a demand problem.
Second, check underpricing, not just overpricing — nearly a third of units are priced below market, and that lost gross is invisible on a sales report.
Third, judge every unit against its own segment and its own region, because national averages describe a market no single dealer operates in.


.svg)