Have a question?

Ask about pricing, appraisals, or how Rapidious Titan works for your rooftops. We'll get back to you within 24 hours.

Pricing questions specific to your lot

Help reading your inventory benchmarks

Getting up Rapidious Titan for your rooftops

Anything else you're not sure who to ask

2,600
+

dealer rooftops monitored

$
14.4
B+

in live retail inventory

$
47.9
B+

in RV sales tracked

Takes 30 seconds
Thank you! Your submission has been received!
Oops! Something went wrong while submitting the form.
See what your inventory is actually worth
Bring a few units from your lot and we'll show you what the real market data says.
Thank you! Your submission has been received!
Oops! Something went wrong while submitting the form.

In 30 minutes, we'll pull your real stock numbers and match them

Book a Call

Published

September 30, 2026

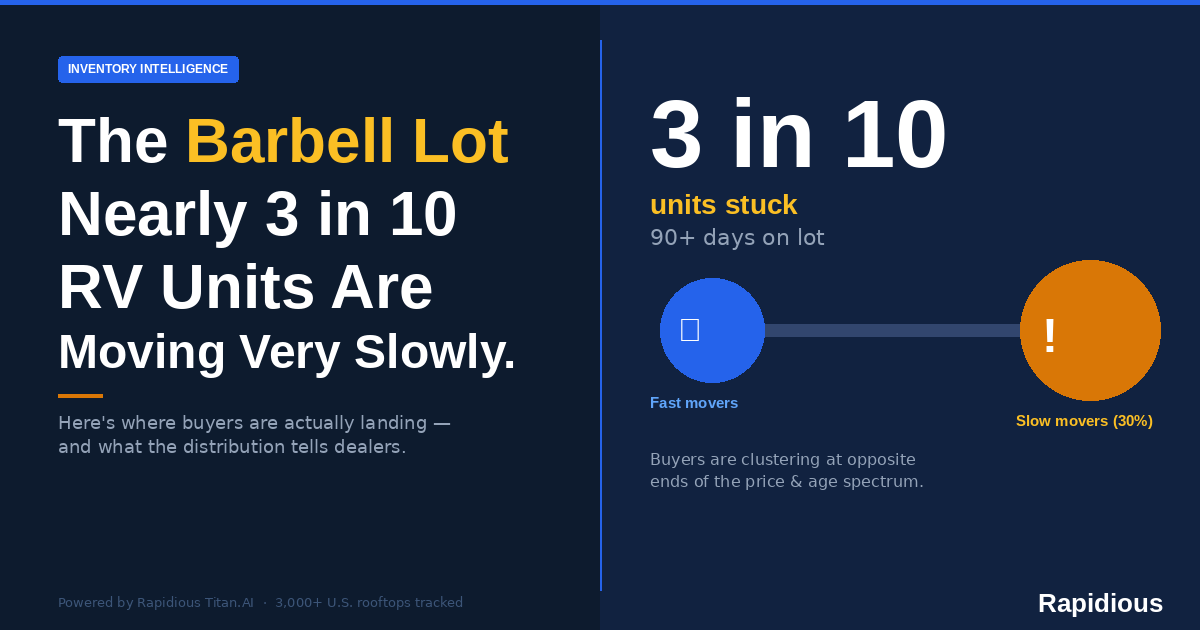
The Barbell Lot: Nearly 3 in 10 RV Units Are Moving Very Slowly. Here's Where Buyers Are Landing.

Rapidious Titan's September 2026 data shows a U.S. RV lot split between fast-moving and very slow stock, and buyers landing on travel trailers (52.1% of units sold), under-$30K units and used RVs (50.6% of units sold). Here's what it means for dealers and OEMs.

Deeksha Makhija, Brand Storyteller and Marketing Lead at Rapidious

Deeksha Makhija

September Rv Market Intelligence Report

Summarize with AI

Table of Contents

Listings don't tell the whole story

Rapidious checks every listing and every sale in the country, every day. See what's actually selling near you, and what your competitors are really doing.

Book a demo
20 minutes. We'll pull up your own inventory live.

Key takeaways

  • Very slow is the biggest bucket. 28.2% of September 2026 inventory (58,996 of 209,545 units, 49 states) sat in the very slow velocity bucket. Rapid held 21.5%.
  • The middle is thin. 40.8% of units were rapid or fast and 39.8% were slow or very slow. Only 19.4% sat on average.
  • Buyers are shifting to used. Used units rose from 41.3% of RV sales in June 2026 to 50.6% in September (24,679 of 48,783 units sold). Travel trailers took 52.1% of sales, in line with their 53.2% share of inventory. In 38 of 44 states, sold units also had a lower median price than inventory. The median gap across 44 states was $3,098 per unit.
  • A state's price level doesn't predict its very slow share. States with low, mid and high inventory median prices all carried a very slow share between 28.3% and 29.0%.
  • More very slow stock goes with weaker sales. The 10 states with the lowest very slow share sold 25.6% of their inventory volume in September. The 10 with the highest sold 22.7%.

How the lot usually gets read

Most dealers judge their lot by two numbers: unit count and days on lot. OEMs use the same measures across their networks for allocation.

But both are averages. In September 2026, the national average days on lot was 172 days across 209,545 units. That average could reflect steady movement—or a lot where half the units sell quickly while the rest sit for a season. Those lots need opposite actions, and the average cannot distinguish them.

The complication: the lot is a barbell

When September 2026 inventory is split by how fast units are moving, the average disappears. The single largest group is the very slow bucket, and it is bigger than the rapid one by 14,031 units.

The biggest bucket on the U.S. RV lot is very slow

Units in inventory by velocity bucket, September 2026 (209,545 units, 49 states)

Rapid
Fast
Average
Slow
Very slow

Rapidious Titan, September 2026 state inventory and sales data · 209,545 units in inventory, 49 states (Hawaii reported none) · shares sum to 100%

Rapid and fast units make up 40.8% of inventory; slow and very slow units make up 39.8%. Only 19.4% sit in the average bucket.

The pattern is national: very slow is the largest bucket in all four regions, ranging from 26.1% in the Northeast to 30.1% in the South.

Very slow is the largest velocity bucket in every U.S. region

% of units in inventory in each velocity bucket, by region, September 2026

Largest bucket in each region

With the two ends nearly equal, a strategy built around the average fits only the 19.4% of units that actually behave like it.

Where buyers are landing

Towables made up 77.5% of September sales and motorhomes 22.5%, broadly matching inventory mix. The bigger shift is toward used units.

Travel trailers took 52.1% of September RV sales

Share of U.S. RV units in inventory (208,683) and units sold (48,783), top 8 RV classes by units sold, September 2026

Share of units in inventory Share of units sold

Travel trailers led with 52.1% of September sales, close to their 53.2% inventory share; fifth wheels followed at 15.3%.

Class A was the standout motorhome class, taking 10.2% of sales from just 6.5% of inventory and posting the highest sell-through among the eight largest classes at 36.7%.

Used units went from 41.3% to 50.6% of RV sales between June and September

Share of U.S. RV units that were new vs used, June and September 2026

Used New

Units sold

Units in inventory

Rapidious Titan, June 2026 vs September 2026 RV class data · all RV classes

Used units made up 37.7% of September inventory but 50.6% of sales, selling through at 31.4% versus 18.5% for new. From June to September, new sales fell 33.0% while used sales were nearly flat. The shift was sharpest in Class A, where 86.3% of sales were used; the South had the highest used-sales share at 53.3%.

By price, buyers land under $30K

Demand also skewed lower-priced: units under $30K made up 35.6% of priced inventory but 42.1% of priced sales, with a 27.7% sell-through. Most of those sales—61.2%—were used.

Under $30K took 42.1% of priced RV sales from 35.6% of priced inventory

Share of U.S. RV units with a listed price, by price band: 178,629 in inventory, 41,748 sold, September 2026

Share of units in inventory Share of units sold

Rapidious Titan, September 2026 price band data · units with a listed price only (excludes 29,873 units in inventory and 6,974 units sold with no price)

Price bands cover only units with a listed price. 29,873 units in inventory and 6,974 units sold (14.3% of each) had no price and are left out. Priced and unpriced counts together come to 181 fewer units in inventory and 61 fewer units sold than the RV class totals.

Sold units cluster below the lot's median price

In 38 of 44 states, the median price of units sold in September 2026 was lower than the median price of units in inventory. The median gap across 44 states was $3,098 per unit.

In 7 of the 8 largest RV markets, sold units landed below the lot median price

Median price of units in inventory vs units sold, September 2026, sorted by gap

Inventory median price Sold units median price
Gap per unit

Rapidious Titan, September 2026 state inventory and sales data · 8 largest states by units in inventory

The further apart the two dots, the wider the gap between what sits on the lot and what buyers took home. Florida's gap is the widest; Washington is the only large market where sold units carried a higher median price.

In seven of the eight largest RV markets, sold units had a median price lower than the inventory median price, by between $2,998 (Pennsylvania) and $9,989 (Florida)

State Units in inventory Inventory median price Units sold Sold units median price Gap per unit
Texas20,494$43,9955,196$36,984$7,011
Florida16,682$49,9843,813$39,995$9,989
California12,720$46,9003,082$39,995$6,905
Michigan8,502$33,9951,648$27,995$6,000
Arizona8,339$49,9951,636$42,998$6,997
Ohio8,241$35,9661,589$31,097$4,869
Pennsylvania7,826$34,9952,091$31,997$2,998
Washington7,096$40,9952,249$43,886−$2,891

The eight largest markets by September inventory, sorted by units in inventory. Gap = inventory median price minus sold units median price.

Washington is the one large market where sold units carried a higher median price than inventory. Vermont, South Dakota, Maryland and Connecticut were the other exceptions, and New Mexico's two medians were equal.

A caution on reading the gap: the two medians describe different sets of units. The gap shows that buyers concentrated at lower price points than the lot as a whole. It does not show that any single unit was discounted.

A state's price level doesn't predict its very slow share

You might think states with expensive RVs would have a harder time selling them, but that's not true. No matter how high or low a state's overall prices are, about 28% to 29% of its RVs always end up stuck in the "very slow" bucket.

The very slow share barely moves from the lowest-priced states to the highest

Price tier (inventory median price) States Units in inventory Very slow units Very slow share
Lower ($29,500–$35,228)1554,40015,43328.4%
Middle ($35,480–$39,486)1448,61313,74328.3%
Higher ($39,888–$49,995)1596,08827,82629.0%

What does differ is how much each state sold. To compare, this piece uses sell-through: units sold in September 2026 divided by units in September 2026 inventory.

States with less stuck stock sold a larger share of their lot

Group Units in inventory Very slow share Units sold Sell-through
10 states with the lowest very slow share57,79824.2%14,80225.6%
10 states with the highest very slow share35,40836.1%8,04122.7%

Lowest group: Maine, Idaho, Pennsylvania, Louisiana, Colorado, New Mexico, Washington, Montana, Texas, Missouri. Highest group: Massachusetts, Kansas, Indiana, Mississippi, Connecticut, Wyoming, Virginia, New Jersey, Florida, South Dakota.

Spotlight: Florida and Texas, the two biggest lots

Texas carried 3,812 more units than Florida in September 2026, yet it sold 1,383 more. The difference is which end of the barbell each state is weighted toward.

Texas is weighted to the fast end of the barbell; Florida to the slow end

September 2026TexasFlorida
Units in inventory20,49416,682
Rapid + fast share45.8% (9,386 units)33.3% (5,559 units)
Very slow share24.9% (5,104 units)37.9% (6,323 units)
Units sold5,1963,813
Sell-through25.4%22.9%
Inventory avg days on lot162 days191 days
Sold units avg days on lot182 days270 days
Inventory median price$43,995$49,984
Sold units median price$36,984$39,995

Florida holds more very slow units than any other state: 6,323, or 10.7% of the national very slow bucket. Its sold units had spent an average of 270 days on the lot, 88 days longer than in Texas. And its inventory median price sat $9,989 above where its buyers actually landed, the widest gap among the eight largest markets.

So what should dealers and OEMs do with a barbell lot?

Run the two ends of the lot as two separate problems. The fast end needs supply. The slow end needs unit-by-unit attention.

For dealers

  1. Track velocity mix, not just average age. Know what share of your lot sits in each velocity bucket every month. The national very slow share in September 2026 was 28.2%, a useful benchmark for your own lot.
  2. Reorder from the fast end. Your rapid and fast units are the clearest signal of what buyers in your market are taking right now. Use them as the starting point for restocking.
  3. Work very slow units one at a time. Identify which models and price points sit in the very slow bucket, and compare each against where local buyers are landing. In 38 of 44 states, that landing point was below the lot's median price.
  4. Watch your gap. Compare your inventory median price with your market's sold units median price each month. A widening gap can be an early sign that the lot is drifting away from where buyers are landing.

For OEMs

  1. Allocate on sell-through and velocity mix, not inventory volume. Texas and Florida hold the two biggest lots, but Texas sold 25.4% of its September inventory and Florida sold 22.9%.
  2. Flag markets above the national very slow share. In September 2026, the 10 states with the highest very slow share sold 22.7% of their inventory, against 25.6% for the 10 lowest. New allocation into high-share markets can add to aging stock.
  3. Target program support at very slow units. Very slow share stayed between 28.3% and 29.0% across state price tiers, so a market's overall price level won't show where very slow stock sits. Aim support at the very slow units themselves, by model and price point.

As the market shifts, the dealers and OEMs who come out ahead won't be the ones with the most units. They will be the ones who can see which end of the barbell each unit sits on, and act on it every month.

FAQ

The September 2026 RV market, in seven answers

The headline number is beside each question. Open one for the full answer.

77.5%of units sold were towables

What types of RVs are buyers purchasing most?

Towables. In September 2026, towables made up 77.5% of the 48,783 RV units sold, and travel trailers alone made up 52.1% (25,405 units). Among motorhomes, Class A sold the most units (4,962).

50.6%of sales were used

Are RV buyers shifting to used units?

Yes. Used units rose from 41.3% of RV sales in June 2026 to 50.6% in September 2026, while new unit sales fell 33.0% over the same period.

28.2%of inventory is very slow

What share of U.S. RV inventory is moving very slowly?

In September 2026, 28.2% of RV inventory (58,996 of 209,545 units across 49 states) sat in the very slow velocity bucket. It was the largest of the five velocity buckets.

19.4%of inventory is average

What is a “barbell” RV lot?

It is a lot where units cluster at the two ends of the velocity range. In September 2026, 40.8% of U.S. RV inventory was rapid or fast, 39.8% was slow or very slow, and only 19.4% was average.

38 / 44states sold below lot median

Are RV buyers paying less than the median price on the lot?

In 38 of 44 states, the median price of RV units sold in September 2026 was below the median price of units in inventory. The median gap across 44 states was $3,098 per unit. The two medians describe different sets of units, so this shows where buyers concentrated, not discounts on specific units.

~29%very slow in every price tier

Do higher RV prices lead to more slow-moving inventory?

Not at the state level. Across 44 states in September 2026, the very slow share was 28.4% in the lowest-priced third, 28.3% in the middle third and 29.0% in the highest-priced third.

6,323very slow units in Florida

Which state has the most very slow RV inventory?

Florida, with 6,323 very slow units in September 2026, or 37.9% of its 16,682 units in inventory.

Source: Rapidious Titan, September 2026 RV inventory and sales data.

‍

See exactly what's sitting, stalling, and costing you.

Drop your details and we'll pull a snapshot of your inventory against live market data; then walk you through it on a quick call.

No prep needed · we analyze your lot · 30-minute call
Pulling your lot details…

Almost there.

You're on the list.

We've pulled your inventory data before we connect so when we talk,
we're looking at your actual units, your pricing gaps, and what's aging on your lot.

Redirecting to book a free inventory pricing snapshot call in 3 seconds...
Oops! Something went wrong while submitting the form.

Previous RV Market Reports

Monthly pricing, inventory velocity, and aging data across the U.S. and Canadian RV market. Every report is built from the same 265,000+ live listings, tracked daily.

Link successfully copied