



Where Does Your Lot Actually Stand?
Listed value and real selling price aren't the same. See if your lot is overpriced, underpriced or sitting for longer than it should be.
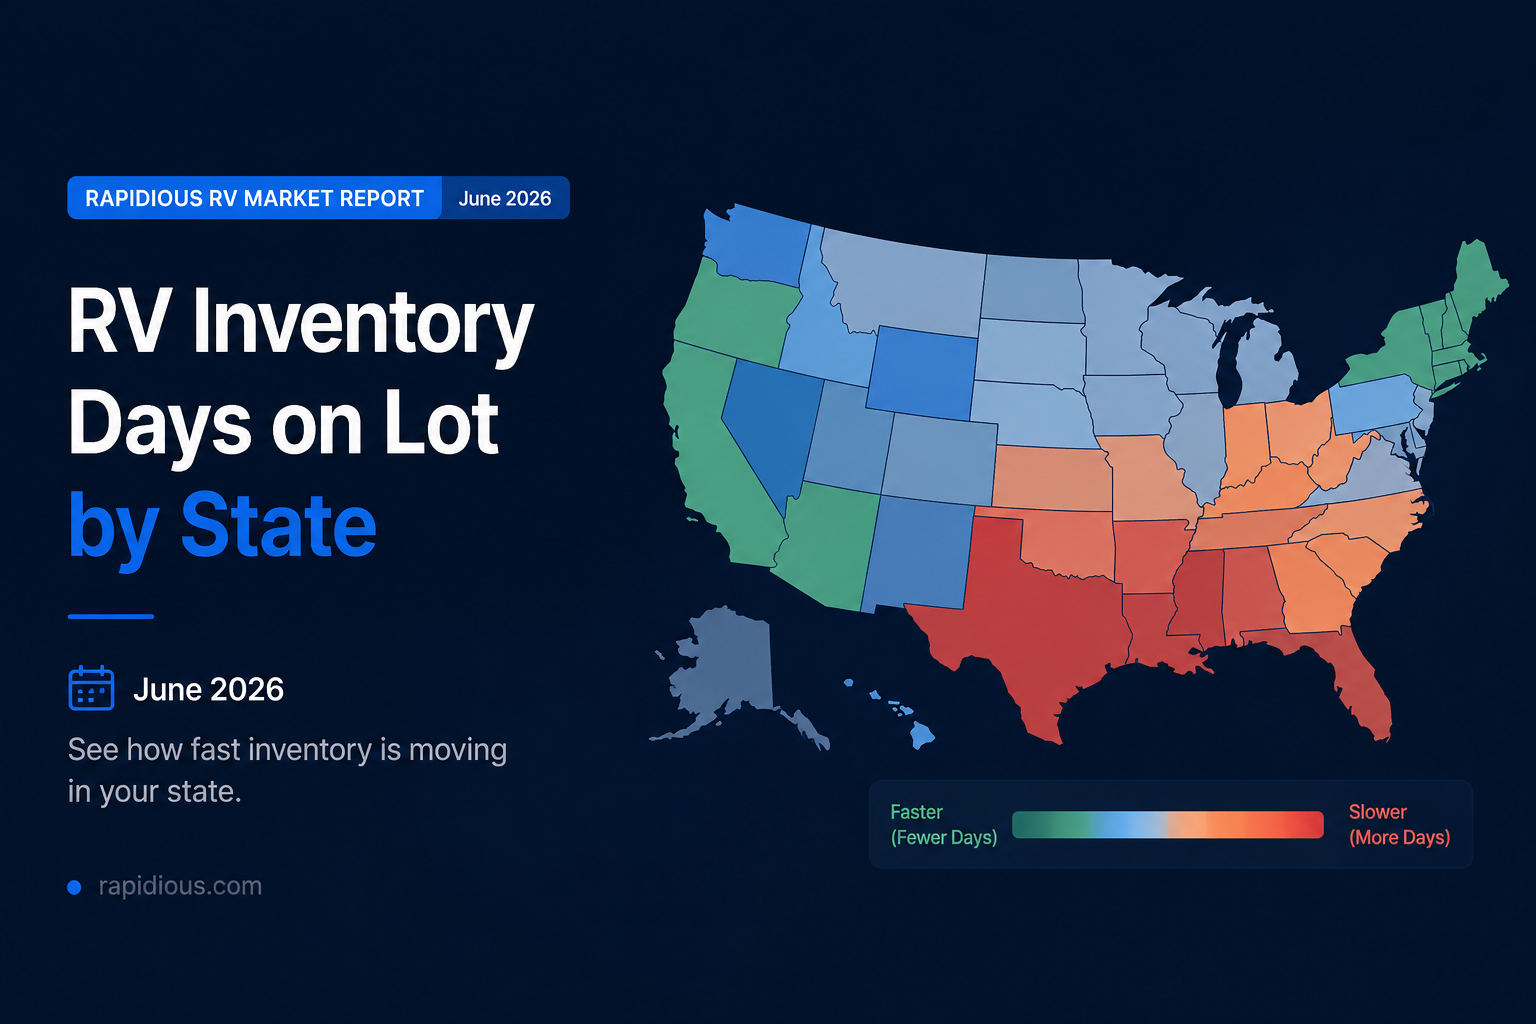
The regional data from Rapidious Titan.AI, a real-time RV market intelligence platform, shows a 164-day spread between the fastest and slowest state in June 2026. Maine averages 125 days on lot. South Dakota averages 289 days. These are the same segment, the same month, the same national market, and they require completely different pricing strategies.
A dealer in South Dakota pricing against the national average is pricing against a number that is 139 days faster than their actual market. A dealer in Maine pricing against the national average may be discounting into a market that does not require it.
Fast Markets: States Where Inventory Is Moving
Slow Markets: States Where Inventory Is Sitting
Florida deserves specific attention. It has 22,694 units on lot and sold 5,525 units in June, the second highest volume of any state. But it averages 217 days on lot and has 7,052 units in the very slow velocity category. High volume does not mean fast market. Florida dealers may be drawing comfort from sales numbers without seeing how long individual units are sitting.
What Dealers Should Take From This
The national average describes almost no RV market accurately in June 2026. A 164-day spread between the fastest and slowest state means every dealer's pricing strategy needs to start with their specific regional reality, not a number that smooths over it.
What This Means for OEMs
Regional demand variance this pronounced suggests OEMs may benefit from allocation strategies that are more regionally responsive rather than treating dealer networks as a single national pool. A model performing well in fast-velocity regions like Texas and Maine might be underrepresented in allocation if national sales data masks strong regional pockets of demand sitting alongside genuinely slow markets.
When fast and slow markets diverge by 164 days in the same month, production allocation and dealer support decisions made at the national level will systematically over-serve some markets and under-serve others. The regional data from Rapidious Titan.AI makes that visible before it appears in order volumes.
Data sourced from Rapidious Titan.AI, a real-time RV market intelligence platform. Based on U.S. dealer inventory tracked daily through June 2026.
RV Market Intelligence, Delivered Weekly.
Actionable insights on pricing shifts, inventory velocity, competitive positioning built from market derived intelligence.
.svg)