



Where Does Your Lot Actually Stand?
Listed value and real selling price aren't the same. See if your lot is overpriced, underpriced or sitting for longer than it should be.
What This Report Covers
This core report draws on four datasets tracked by Rapidious Titan.AI, a real-time RV market intelligence platform, covering segment-level inventory movement, regional velocity by state, unit-level model aging, and pricing against market benchmarks across US dealer lots through June 2026.
The data shows a market moving in two clear directions at the same time. Some segments are under significant and accelerating pressure. Others are quietly improving. Each finding below is summarized here and covered in full in a dedicated detailed report.
Finding 1: Class A Used Is the Most Pressured Segment
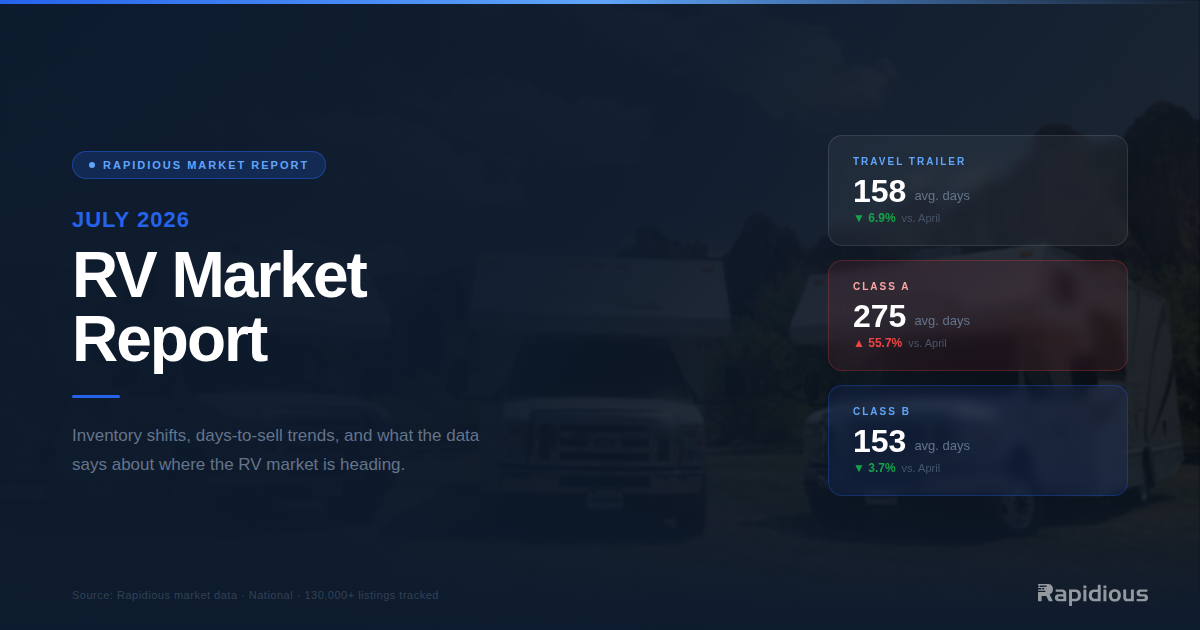
Of all the segments Rapidious Titan.AI tracks, Class A used motorhomes showed the sharpest deterioration in Q2 2026. Average days on inventory rose from 172 days in March to 330 days in June, a 91% increase in a single quarter. Inventory count grew from 8,368 to 12,320 units. Units are sitting nearly twice as long as they were 90 days ago, while more units continue to arrive.
The units that are moving are moving in approximately 125 days. The units that are not are dragging the segment average to 330 days. The difference is almost always a pricing decision made, or not made, earlier in the unit's time on lot.
Finding 2: The Regional Divide Is the Most Actionable Finding
The regional data from Rapidious Titan.AI shows a 164-day spread between the fastest and slowest state in June 2026. Maine averages 125 days. South Dakota averages 289 days. Texas sold 8,425 units in June, the highest volume of any state. Alabama averaged 245 days, Florida 217 days despite high volume.
A dealer in Maine and a dealer in South Dakota are operating in fundamentally different markets in the same month. A national average describes almost no market accurately. Every pricing decision should start with a dealer's specific state velocity, not the national number.
Finding 3: Two Segments Are Genuinely Improving
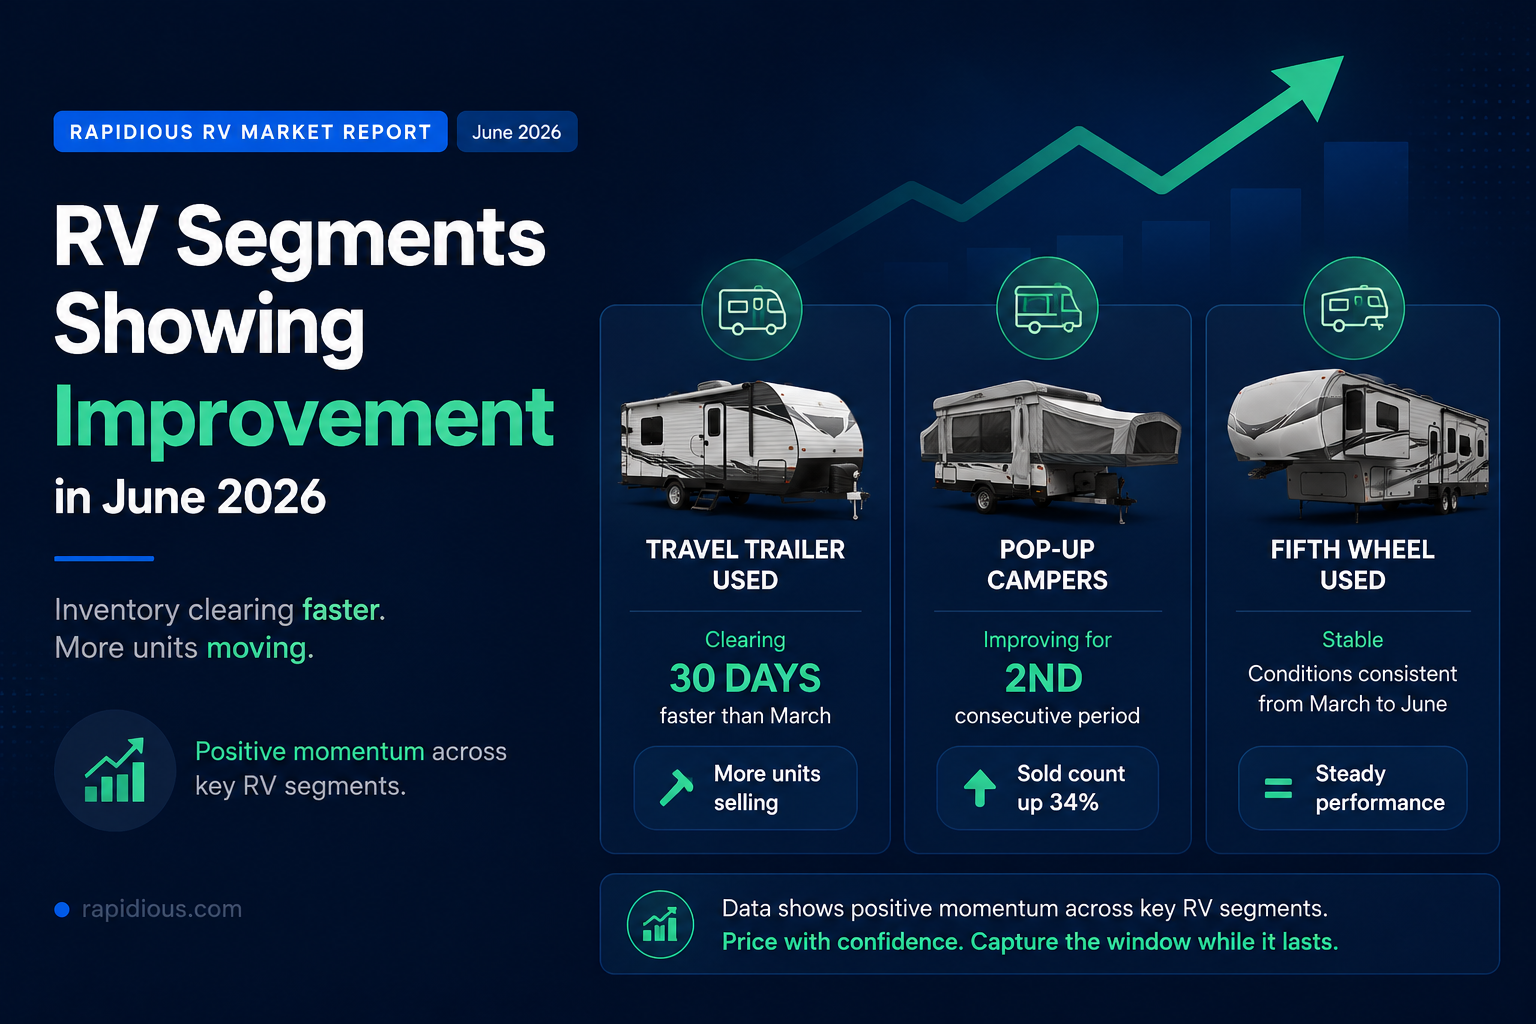
Not all segments are under pressure. Travel trailer used days on inventory improved from 182 days in March to 152 days in June, while sold count rose from 11,948 to 14,441 units. Pop-up campers improved from 180 days to 163 days, with sold count up 34%, marking the second consecutive data period showing improvement. Fifth wheel used held steady.
For dealers carrying inventory in these categories, the data from Rapidious Titan.AI supports confident pricing right now. The window is open.
Finding 4: The Model-Level Picture Is Highly Uneven
At the unit level, the June 2026 data from Rapidious Titan.AI shows significant divergence even within the same brand and segment. Two configurations dropped median age from 137 days to 55 and 61 days respectively in 60 days, clearing fast. Others saw inventory double while median age rose sharply with no price movement.
Two models received price reductions of $7,000 and $14,801 in a 60-day window and are still not clearing. And 2025, 2026, and 2027 model year units are simultaneously present on lots across the country, creating a pricing complexity that static benchmarks are not built to handle.
The June 2026 data makes one thing clear: the RV market is not moving uniformly. The dealers and OEMs who act on segment-specific and region-specific intelligence right now will be in a materially different position by the end of Q3 than those pricing against national averages.
Data sourced from Rapidious Titan.AI, a real-time RV market intelligence platform. Based on U.S. dealer inventory tracked daily through June 2026.
RV Market Intelligence, Delivered Weekly.
Actionable insights on pricing shifts, inventory velocity, competitive positioning built from market derived intelligence.

.svg)