Listings don't tell the whole story
Rapidious checks every listing and every sale in the country, every day. See what's actually selling near you, and what your competitors are really doing.
The Used RV Price Paradox: Why Lower Prices Aren't Moving Used Motorhomes
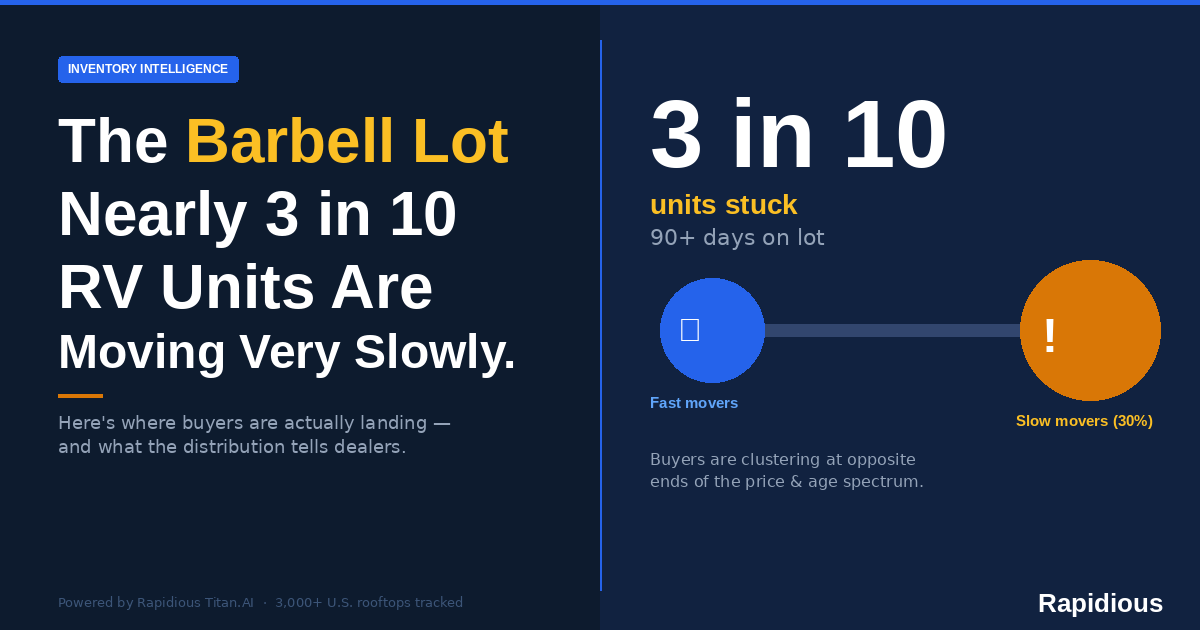
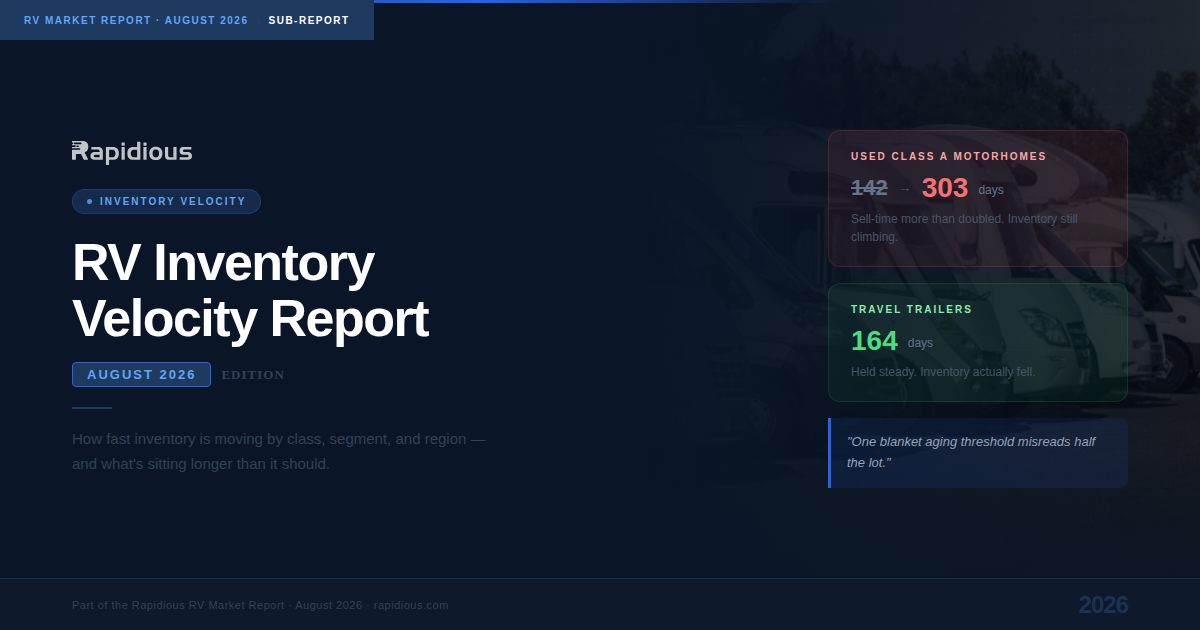
Used Class A asking prices are 9.1% lower than a year ago, yet more than half of listings have been on the lot 90+ days. Lower prices are moving used travel trailers. For used motorhomes, the price tag may not be the problem — time on the lot may be.
Rapidious Market Intelligence · Market-wide U.S. dealer listing data · Data as of October 31, 2026
In October 2026, the median asking price for a used Class A motorhome was $89,990 — about $9,000 (9.1%) lower than a year earlier — yet 54.4% of the 8,200 used Class A listings had sat 90+ days, up from 46.3%. Lower prices moved used travel trailers, but not used motorhomes: a sharp rise in supply, a monthly payment that barely moves with a cut, and high carrying costs appear to outweigh the price drop.
Used RV asking prices usually fall for one reason: to move units faster. Over the past year, that seems to have worked for travel trailers. For used motorhomes, it may not have. A buyer looking today pays less for the same kind of coach — and the listings still aren't moving faster.
The signal in the data
Used Class A is the only class where more than half of listings have passed 90 days on the lot. The pattern is strongest in used motorhomes. Compared with October 2025:
Class A: median asking price down 9.1%, aged 90+ share up from 46.3% to 54.4%, median days on lot up from 79 to 95.
Class B: median price down 9.9%, aged share up from 38.4% to 48.1%.
Class C: median price down 12.7% (the steepest drop), aged share up slightly from 47.8% to 49.6%.
It does not appear to be simply older coaches entering the market. Within the same model years (2019–2023), used Class A asking prices still fell 8.3% and the aged share still rose. Listings that did sell tell the same story: used Class A sold in October 2026 had been listed an average of 242 days, roughly twice as long as any other class (110–136 days).
Travel trailers: the useful control
Used travel trailer asking prices fell too — by 5.9% to a median $22,500. But there, fewer listings aged: the aged 90+ share dropped from 50.4% to 46.9%, and the median listing had been on the lot 80 days instead of 90. Both classes age every winter; the difference shows up in the selling season. From May to August 2026, the share of used Class A listings sitting 90+ days stayed 9 to 16 points above travel trailers — in the months when buyers are usually most active.
Same market, same months, both cheaper than a year ago. At $22,500, a price cut appears to still help. At $90,000, it appears not to be enough on its own.
Three forces that may be behind it
1. More coaches, not more buyers
Used motorhome listings grew 20% to 29% in a year (Class A from 6,359 to 8,200). Used travel trailer listings grew just 5.9%. When supply rises that fast and demand stays flat, more listings age even at lower prices. J.D. Power reports a dealer consensus that demand is flat for both new and used RVs (J.D. Power Q2 2026). Part of the rise may also reflect listings leaving more slowly rather than more arriving.
2. The payment, not the price tag
As an illustration, a $90,000 coach financed in full at 8% over 15 years costs about $860 a month. A 9% price cut takes that down by roughly $77. For a buyer already carrying housing and auto debt, that may not change the answer. Camping World lists higher consumer debt, interest rates and reduced access to credit among reasons customers delay or skip purchases (Camping World Q3 2026 10-Q). (Payment figure is an illustrative single example, not a market average.)
3. The cost of running one
Motorhomes carry their own engine, and their running costs come with them. J.D. Power has described fuel costs as a growing headwind for RV demand, particularly for Class A and Class C (J.D. Power Q1 2026), and reported used Class C values down 10% year over year through Q2.
What it costs dealers
An estimated $1.54 billion in used RV listings had been on the lot 90+ days at the end of October 2026, up from about $1.4 billion a year earlier. Used Class A alone accounts for roughly a third of that value, on just 14% of the aged listings.
Every one of those listings costs money while it waits. Matrix Capital Markets Group notes that as units sit, dealers pay ongoing floor plan interest with capital tied up in assets that earn nothing, and aged used inventory adds depreciation risk as wholesale values fall (Matrix, March 2026). A price cut that does not move the listing adds margin loss on top.
How does your lot compare?
These figures are market-wide. Rapidious shows how your own used inventory measures up against comparable listings in your market — share aged 90+ days, days on lot and asking price, listing by listing.
Get your lot report →What the data is saying
Buyers have not left the used market. Travel trailers show that lower prices can still bring listings down. But for used motorhomes, the data suggests price alone may not be the lever: supply is up sharply, the monthly payment barely moves with a cut, and every extra month adds carrying cost. For dealers holding used motorhomes, the useful question may be less "should I cut the price?" and more "which units, how early, and how many should I take in on trade?"
Frequently asked questions
According to Rapidious U.S. listing data, used Class A asking prices fell 9.1% over the year to a median $89,990 in October 2026, yet the share of listings aged 90+ days rose from 46.3% to 54.4% (of 8,200 listings). Three forces appear to outweigh the price cut: used motorhome listings grew 20–29% in a year while demand stayed flat, a 9% cut on a ~$90,000 coach lowers the monthly payment by only about $77, and motorhomes carry high running and fuel costs.
Yes. Used travel trailer asking prices fell 5.9% to a median $22,500 over the year, and the aged 90+ share dropped from 50.4% to 46.9% — the only class where it fell. At a ~$22,500 price point, a cut still appears to help clear listings; at ~$90,000 for a Class A, it appears not to be enough on its own.
The 1,718 used Class A units sold in October 2026 had been listed an average of 242 days — roughly twice as long as any other class (travel trailer 123, Class C 132, fifth wheel 136, Class B 110 days).
An estimated $1.54 billion in used RV listings had been on the lot 90+ days at the end of October 2026, across roughly 31,300 aged listings in five classes — up from about $1.4 billion a year earlier. Used Class A accounts for about a third of that value (~$535M) on just 14% of the aged listings.
Appendix: the data in detail
| Used RV class (U.S.) | Listings | Aged 90+ share | Median days on lot | Median asking price |
|---|---|---|---|---|
| Class A | 6,359 → 8,200 (+28.9%) | 46.3% → 54.4% | 79 → 95 | $98,995 → $89,990 (−9.1%) |
| Class B | 1,558 → 1,970 (+26.4%) | 38.4% → 48.1% | 67 → 85 | $99,900 → $89,995 (−9.9%) |
| Class C | 5,217 → 6,271 (+20.2%) | 47.8% → 49.6% | 84 → 88 | $76,900 → $67,098 (−12.7%) |
| Fifth wheel | 10,152 → 11,300 (+11.3%) | 48.4% → 49.0% | 84 → 87 | $45,304 → $41,900 (−7.5%) |
| Travel trailer | 34,789 → 36,827 (+5.9%) | 50.4% → 46.9% ↓ | 90 → 80 ↓ | $23,900 → $22,500 (−5.9%) |
| Rapidious market-wide U.S. used listings. Aged share and days on lot are month-end readings. Figures rounded. | ||||
| Used RV class | Listings | Median asking price | Aged 90+ share |
|---|---|---|---|
| Class A | 2,473 → 2,162 | $119,900 → $110,000 (−8.3%) | 47.0% → 50.3% |
| Class B | 943 → 902 | $99,998 → $95,000 (−5.0%) | 38.6% → 47.4% |
| Class C | 2,651 → 2,483 | $79,998 → $69,999 (−12.5%) | 49.3% → 49.2% |
| Fifth wheel | 5,750 → 5,931 | $49,944 → $44,950 (−10.0%) | 50.4% → 50.5% |
| Travel trailer | 18,859 → 21,144 | $24,700 → $22,284 (−9.8%) | 52.6% → 48.7% |
| Controls for listing-mix changes. Average model year of all used listings barely changed (Class A 2015.9 → 2015.7). The Class B like-for-like group is small (~900 listings) — treat as directional. | |||
| Used RV class | Listings sold | Average days to sale |
|---|---|---|
| Class A | 1,718 | 242 |
| Fifth wheel | 2,862 | 136 |
| Class C | 1,461 | 132 |
| Travel trailer | 7,901 | 123 |
| Class B | 486 | 110 |
| Days to sale = calendar days from a listing's first sighting to the day it stopped appearing, averaged for October 2026. Sale records begin November 2025. | ||
| Used RV class | Aged 90+ listings | Avg asking price of aged listings | Estimated value |
|---|---|---|---|
| Class A | 4,460 | $120,037 | ~$535M |
| Travel trailer | 17,256 | $25,296 | ~$437M |
| Fifth wheel | 5,532 | $44,834 | ~$248M |
| Class C | 3,113 | $73,053 | ~$227M |
| Class B | 947 | $96,451 | ~$91M |
| Total | 31,308 | — | ~$1.54B |
| Estimated as aged listing count × average asking price of aged listings in each class. Figures rounded; components may not sum exactly to the total. | |||
Methodology and data notes
- Rapidious data: market-wide U.S. active dealer listings from Rapidious listing snapshots dated September 30, 2026, October 31, 2026 and October 31, 2025. Classes covered: travel trailer, fifth wheel, Class A, Class B, Class C.
- Days on lot / aged 90+: calendar days from when a listing first appears online until it stops appearing; for listings still active, counted to the snapshot date. Aged share = listings at 90+ days ÷ active listings in that class and condition.
- Prices: advertised asking prices, not transaction prices. Listings without an asking price are excluded. Changes in listing mix can move medians; a like-for-like check on model years 2019–2023 is included to control for this.
- Aged inventory value: estimated as aged listing count × average asking price of aged listings in each class. Figures are rounded.
- Sold: a listing that stops appearing is treated as sold; some removals may reflect transfers, wholesale or delisting. Days to sale = calendar days from a listing's first sighting to the day it stopped appearing, reported as an average for October 2026; sale records begin November 2025.
- External data: cited inline (J.D. Power, Camping World Q3 2026 10-Q, Matrix Capital Markets Group). Valuation and registration sources use their own methods and periods and are not directly comparable to listing data. Percentages and dollar values are rounded, so some totals may not sum exactly.