

The Regional Picture Is Deeply Uneven
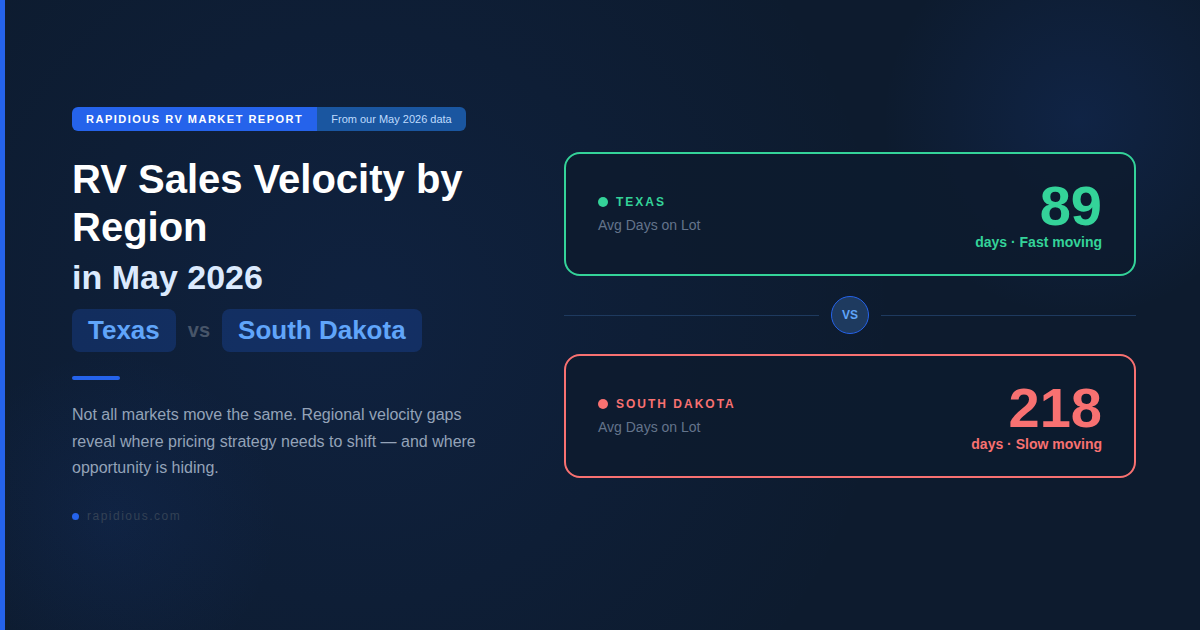
May's data revealed one of the sharpest regional divides Rapidious Titan.AI has tracked to date. Texas dealers moved 30% of their total inventory in May alone, one of the strongest monthly velocity readings recorded anywhere in the country this year. South Dakota, in the same month, averaged 289 days on lot across its dealer network, inventory sitting for the better part of a year before selling.
This isn't a minor variance that washes out in a national average. It's a structural divide that a single nationwide benchmark simply cannot capture. A pricing strategy calibrated to "what's competitive" at the national level will be wrong in both directions depending on where a dealer actually operates, too conservative for a fast-moving market like Texas, where units could likely command a stronger price and still sell quickly, and too aggressive for a market like South Dakota, where the same price might sit untouched for months.
The deeper implication is that regional market conditions, population density, seasonal usage patterns, local economic conditions, competing dealer density, create genuinely different markets operating under the same national industry umbrella. Treating them as one undifferentiated market, which is effectively what book value and national benchmarks do, guarantees that some dealers are mispriced relative to their actual local conditions, regardless of how carefully they've done their homework otherwise.
What This Means for Dealers
If you're in a high-velocity market like Texas, there may be room to hold pricing firmer than a national benchmark would suggest, since demand is clearly absorbing inventory quickly. If you're in a slower market like South Dakota, waiting for a national-average price to "work" may mean watching a unit age well past the point where it should have been repriced. The action item is benchmarking against your specific region and, where possible, against your specific local competitive set, not the national number.
What This Means for OEMs
Regional demand variance this pronounced suggests OEMs may benefit from allocation strategies that are more regionally responsive rather than treating dealer networks as a single national pool. A model performing exceptionally well in fast-velocity regions might be underrepresented in allocation if national sales data masks strong regional pockets of demand sitting alongside genuinely slow ones.
The throughline is that a single national number can no longer speak for markets moving at such different speeds. Reading the live, local market in real time is quickly becoming the baseline for pricing an RV well, not the edge it used to be.
Data sourced from Rapidious Titan.AI, a real-time RV market intelligence platform. Based on U.S. dealer inventory tracked daily through May 2026.


.svg)


-
Heading 2
Heading 3
Heading 4
Lorem ipsum dolor sit amet, consectetur adipiscing elit, sed do
Ordered list
Unordered list
Text link
Bold text
Emphasis
-